---
title: "Spatial autocorrelation and Moran's I in R"
description: "Nearby sites resemble each other, breaking the independence regression assumes. Moran's I measures it, a correlogram shows its scale, a residual test finds it."
date: "2026-05-03 14:00"
date-modified: "2026-09-30"
categories: [R, spatial, spdep, regression, ecology tutorial]
image: thumbnail.png
image-alt: "A correlogram of Moran's I: three dark green points falling steeply from a high value, then five gold points lying slightly below a dashed line at the expected value."
---
*Corrected 30 September 2026: the closing section credited `spdep` with fitting simultaneous and conditional autoregressive models, which now live in `spatialreg`, and called the residual Moran's I the diagnostic for any spatial regression; it is derived for an ordinary least-squares fit like the one in this post.*
*Updated 29 September 2026: the residual test now reports `lm.morantest()`, which is built for the residuals of a fitted linear model, next to `moran.mc()`.*
*Corrected 25 September 2026: the correlogram paragraph said Moran's I fades out near the field's range and that sites farther apart carry no detectable dependence. The range in the simulation is the scale of an exponential covariance that never reaches zero, so sites beyond it are still linked; the paragraph, figure caption and alt text now say why the correlogram crosses zero before the dependence ends.*
The regression posts on this blog, the [count GLM](../glm-count-data-abundance/) and the [GAM](../gam-species-response-curves/), all rest on one quiet assumption: the observations are independent. For data collected across space, that assumption is usually wrong. Sites near each other tend to have similar values, whether because the environment varies smoothly or because of processes like dispersal and local interaction. This is spatial autocorrelation, and it violates the independence that standard tests need (Legendre 1993). When it goes unnoticed it does real damage: it shrinks the effective sample size, deflates standard errors, and can turn noise into a significant result.
This post measures spatial autocorrelation with Moran's I using `spdep`, shows how it changes with distance through a correlogram, uses it as a diagnostic on regression residuals, and then demonstrates what it does to a test that ignores it.
## A spatially structured variable
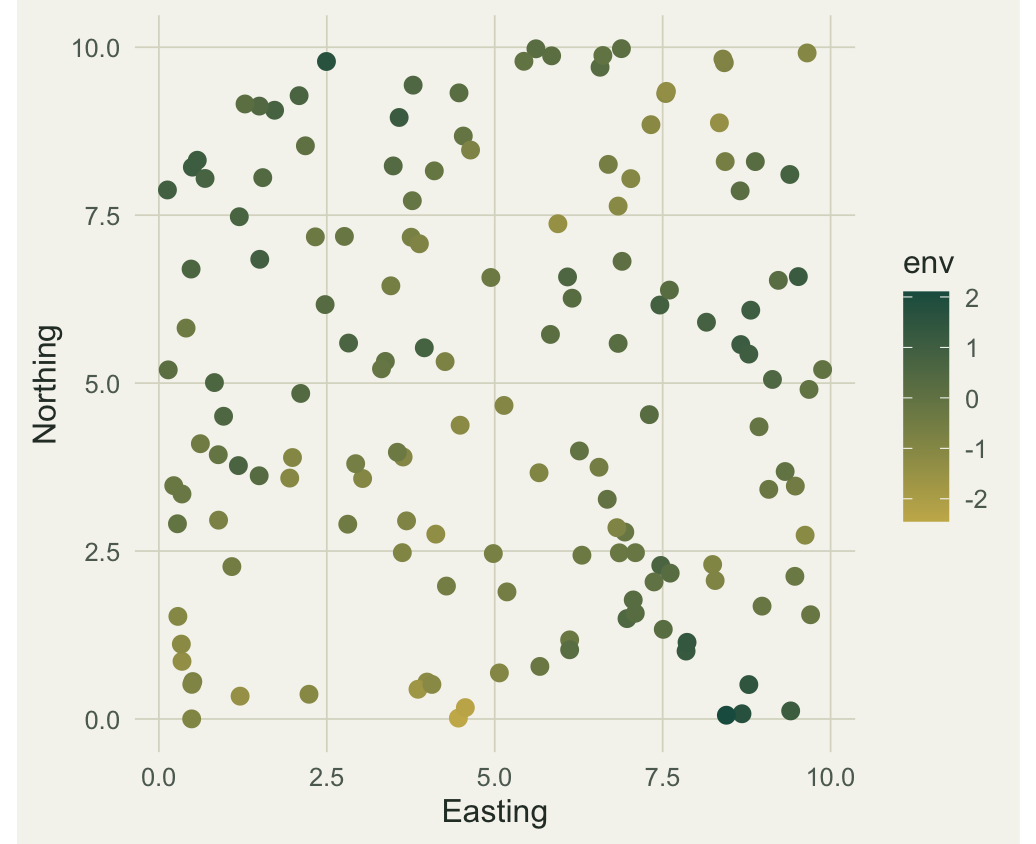
The sampling points are scattered over a square. The environmental variable is a Gaussian random field with an exponential covariance, so nearby points are correlated and the correlation fades with distance. The same block also defines a second spatial driver and a response built from both, which we return to for the regression diagnostic.
```{r}
#| label: setup
#| code-fold: true
#| code-summary: "Setup: packages, helper functions, colours and plot theme (run this first)"
#| results: hide
#| message: false
#| warning: false
library(ggplot2)
pal <- list(paper="#f5f4ee", ink="#16241d", body="#2c3a31", forest="#275139",
            line="#dad9ca", sage="#93a87f", gold="#cda23f", terra="#b5534e",
            faint="#5d6b61", low="#c9b458", high="#1d5b4e")
th <- function(base=12) theme_minimal(base_size=base) +
  theme(panel.grid.minor=element_blank(),
        panel.grid.major=element_line(color=pal$line, linewidth=.3),
        plot.background=element_rect(fill=pal$paper, color=NA),
        panel.background=element_rect(fill=pal$paper, color=NA),
        axis.title=element_text(color=pal$body), axis.text=element_text(color=pal$faint),
        legend.title=element_text(color=pal$body), legend.text=element_text(color=pal$faint),
        plot.title=element_text(color=pal$ink, face="bold"),
        strip.text=element_text(color=pal$ink, face="bold"))
```
```{r}
#| label: data
#| warning: false
#| message: false
library(spdep)

set.seed(54)
n <- 150
coords <- cbind(x = runif(n, 0, 10), y = runif(n, 0, 10))
Dm <- as.matrix(dist(coords))

rfield <- function(D, range, sd = 1){            # Gaussian field, exponential covariance
  Sigma <- sd^2 * exp(-D / range)
  L <- chol(Sigma + diag(1e-9, nrow(D)))
  as.vector(crossprod(L, rnorm(nrow(D))))
}
env   <- rfield(Dm, range = 2.5)                        # measured predictor, spatially structured
sp2   <- residuals(lm(rfield(Dm, range = 2.0) ~ env))   # a second driver, made orthogonal to env
y     <- 1.0 + 1.5 * env + 1.2 * sp2 + rnorm(n, 0, 0.6) # response we model further down
randv <- rnorm(n)                                       # a variable with no spatial structure
```
```{r}
#| label: fig-map
#| fig-cap: "The environmental variable over space. Nearby points tend to share a colour: that visible patchiness is spatial autocorrelation."
#| fig-alt: "A map of points coloured by an environmental value, with nearby points sharing similar colours so the surface looks patchy."
#| fig-width: 5.4
#| fig-height: 4.4
#| warning: false
#| message: false
ggplot(data.frame(coords, env), aes(x, y, color = env)) +
  geom_point(size = 2.6) +
  scale_color_gradient(low = pal$low, high = pal$high, name = "env") +
  coord_equal() + labs(x = "Easting", y = "Northing") + th()
```
## Moran's I
Moran's I is a correlation coefficient for a variable with itself across space. Each pair of sites contributes the product of their two deviations from the mean, weighted by how much the two sites count as neighbours. If neighbouring sites tend to be on the same side of the mean, I is positive (clustering); if they alternate, I is negative (a checkerboard). Under no spatial pattern the expected value is not zero but slightly below it, at minus one over (n minus one).
The weights come from a neighbour definition. Here every site is linked to its eight nearest neighbours, and the links are row-standardised so each site's neighbours sum to one.
```{r}
#| label: weights
#| warning: false
#| message: false
nb <- knn2nb(knearneigh(coords, k = 8))
lw <- nb2listw(nb, style = "W")
-1 / (n - 1)            # expected I under no autocorrelation
```
A permutation test compares the observed I to its distribution under random reshuffling of the values across locations. Run it on the structured variable and on a variable with no spatial pattern.
```{r}
#| label: moran
#| warning: false
#| message: false
set.seed(1); mi_env  <- moran.mc(env, lw, nsim = 999)
set.seed(1); mi_rand <- moran.mc(randv, lw, nsim = 999)
c(env_I = round(mi_env$statistic, 3),    env_p = mi_env$p.value,
  random_I = round(mi_rand$statistic, 3), random_p = mi_rand$p.value)
```
The structured variable has an I near 0.52, far above its expectation and significant at the permutation floor. The random variable sits close to zero, indistinguishable from its expected value, and is not significant. Moran's I is doing what it should: flagging the spatial pattern and ignoring its absence.
## How far does it reach?
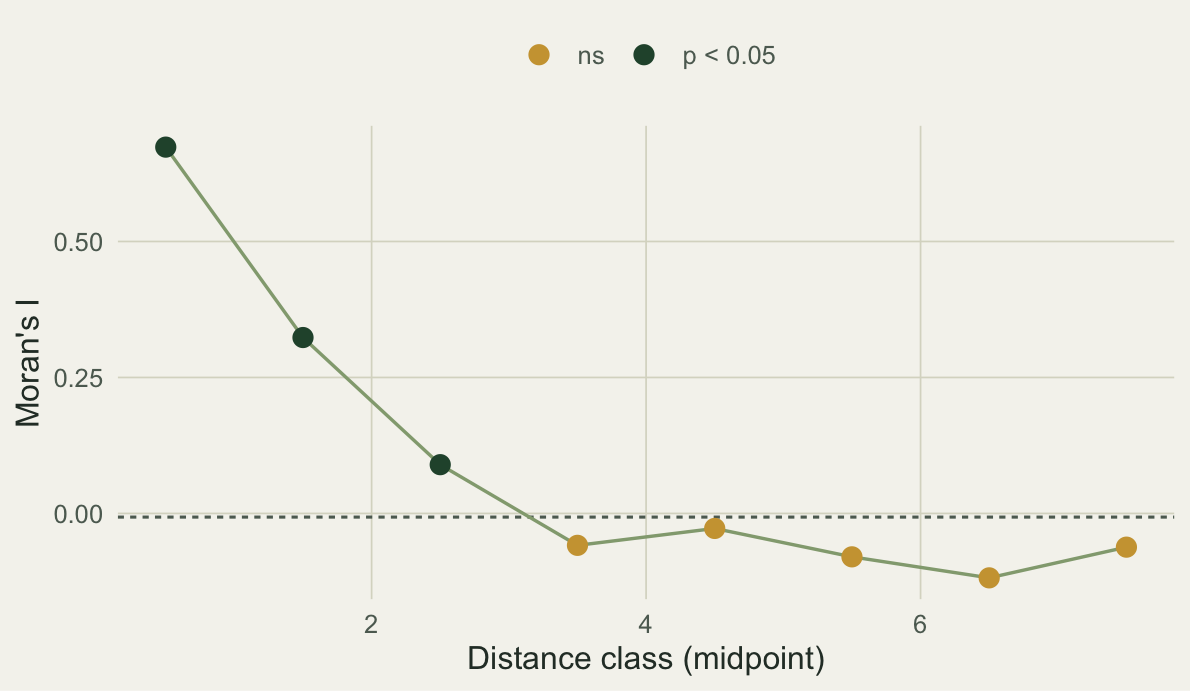
A single Moran's I summarises autocorrelation at the scale of the neighbour definition. A correlogram breaks it out by distance: compute I using only pairs of sites within each distance band, and watch it decay.
```{r}
#| label: fig-correlogram
#| fig-cap: "Moran's I by distance class. Autocorrelation is strong at short distances and crosses zero at a distance of about three, where the field correlation is still about 0.3; the one-sided test marks the negative bands beyond as not significant. The dashed line is the expected I under no autocorrelation."
#| fig-alt: "A correlogram of Moran's I by distance class: high positive autocorrelation at short distances, falling from about 0.67 to about 0.09 over the first three bands, which are dark green for significant, then crossing zero at about three and staying slightly negative in gold beyond, with a dashed expected line just below zero."
#| fig-width: 6.2
#| fig-height: 3.6
#| warning: false
#| message: false
breaks <- seq(0, 8, by = 1)
corr <- data.frame(lo = head(breaks, -1), hi = tail(breaks, -1), I = NA, p = NA)
for (i in seq_len(nrow(corr))){
  nbd <- dnearneigh(coords, corr$lo[i], corr$hi[i])
  if (sum(card(nbd)) > 0){
    lwd <- nb2listw(nbd, style = "W", zero.policy = TRUE)
    mm  <- moran.test(env, lwd, zero.policy = TRUE)
    corr$I[i] <- mm$estimate[1]; corr$p[i] <- mm$p.value
  }
}
corr$mid <- (corr$lo + corr$hi) / 2
corr$sig <- ifelse(corr$p < 0.05, "p < 0.05", "ns")

ggplot(corr, aes(mid, I)) +
  geom_hline(yintercept = -1/(n-1), linetype = "22", color = pal$faint) +
  geom_line(color = pal$sage, linewidth = .6) +
  geom_point(aes(color = sig), size = 3) +
  scale_color_manual(values = c("p < 0.05" = pal$forest, "ns" = pal$gold), name = NULL) +
  labs(x = "Distance class (midpoint)", y = "Moran's I") + th() +
  theme(legend.position = "top")
```
Autocorrelation is around 0.67 for the closest pairs, halves by the next band, and is no longer significantly positive past a distance of about three. That is not where the dependence ends. The `range` of 2.5 in `rfield()` is the scale of an exponential covariance, which never reaches zero: two sites three units apart still share a field correlation of `r sprintf("%.2f", exp(-3 / 2.5))`. Each band is compared with the mean over all sites, so the correlogram crosses zero while pairs are still linked. The negative bands beyond come from that comparison and from the noise of a single field, not from sites repelling each other, and `moran.test()` tests only the positive tail by default, so a band that falls below its expected value can never show as significant. The [Mantel correlogram section](../mantel-tests-distance-correlation/#the-mantel-correlogram-similarity-by-distance-class) measures the same effect on a field whose range is known.
## The regression diagnostic
Here is where Moran's I earns its place in a modelling workflow. The response `y` defined earlier depends on `env` plus a second spatial driver `sp2`, which we now treat as unmeasured. Fit the obvious model that uses only `env`, then look at its residuals. The chunk tests them twice: with `moran.mc()`, the permutation test used above, and with `lm.morantest()`, which is built for the residuals of a fitted linear model (the third caution at the end explains the difference).
```{r}
#| label: residual-test
#| warning: false
#| message: false
m1 <- lm(y ~ env)            # omits the second driver
m2 <- lm(y ~ env + sp2)      # includes it

set.seed(1); r1 <- moran.mc(residuals(m1), lw, nsim = 999)
set.seed(1); r2 <- moran.mc(residuals(m2), lw, nsim = 999)
l1 <- lm.morantest(m1, lw)   # the same I, tested against the null for residuals
l2 <- lm.morantest(m2, lw)
signif(rbind(
  `y ~ env`        = c(env_coef = coef(m1)[2], resid_I = r1$statistic, p = r1$p.value,
                       p_lm = l1$p.value),
  `y ~ env + sp2`  = c(env_coef = coef(m2)[2], resid_I = r2$statistic, p = r2$p.value,
                       p_lm = l2$p.value)), 3)
```
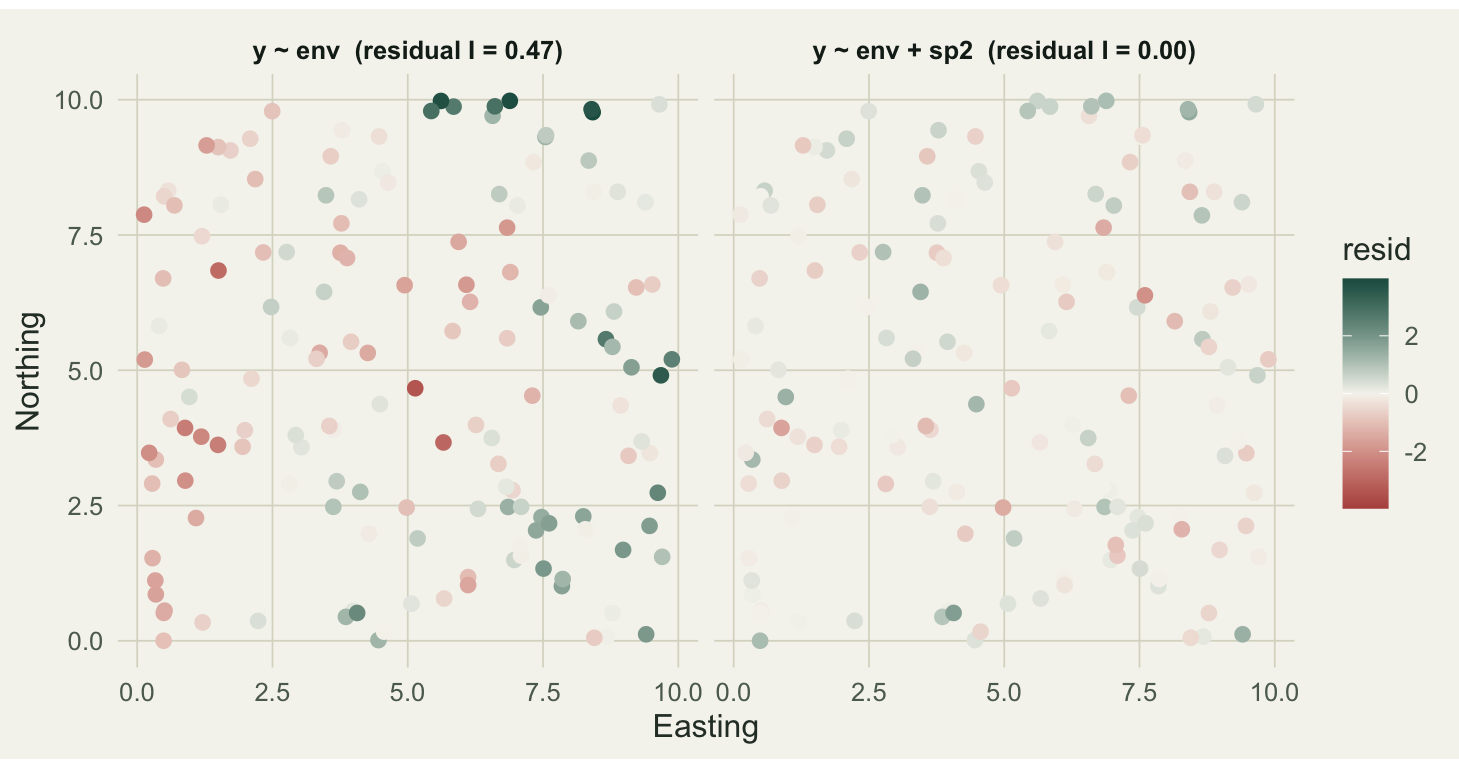
Both models put the same coefficient on `env`, near the true value of 1.5. The difference is in the residuals. The first model leaves out the second spatial driver, so its residuals still carry that structure: Moran's I near 0.47, strongly significant. The second model captures it, and its residuals are spatially flat, with an I indistinguishable from zero. The point estimate looked fine either way; only the residual test revealed that the first model's assumptions were broken.
```{r}
#| label: fig-resid
#| fig-cap: "Residuals in space. Left: the model that omits the second driver leaves visible patches of high and low residuals. Right: the full model's residuals scatter with no spatial pattern."
#| fig-alt: "Two residual maps: the reduced model leaves visible patches of high and low residuals, while the full model's residuals scatter with no spatial pattern."
#| fig-width: 7.6
#| fig-height: 4.0
#| warning: false
#| message: false
rd <- rbind(
  data.frame(coords, resid = residuals(m1),
             model = sprintf("y ~ env  (residual I = %.2f)", r1$statistic)),
  data.frame(coords, resid = residuals(m2),
             model = sprintf("y ~ env + sp2  (residual I = %.2f)", r2$statistic)))
lim <- max(abs(rd$resid))
ggplot(rd, aes(x, y, color = resid)) +
  geom_point(size = 2.2) + facet_wrap(~model) +
  scale_color_gradient2(low = pal$terra, mid = pal$paper, high = pal$high,
                        midpoint = 0, limits = c(-lim, lim), name = "resid") +
  coord_equal() + labs(x = "Easting", y = "Northing") + th()
```
## Why a flat residual map matters
Leaving autocorrelation in the residuals is not a cosmetic problem. The standard errors and p values from `lm` assume independent residuals; when the residuals are autocorrelated, those numbers are not trustworthy, and with positive autocorrelation they are usually too optimistic. The cleanest way to see the cost is a simulation: regress one spatial field on a second, unrelated spatial field, where the true slope is zero, and count how often the test calls it significant.
```{r}
#| label: type1
#| warning: false
#| message: false
type1 <- function(nrep, n, range, alpha = 0.05){
  rej_sp <- 0; rej_iid <- 0
  for (r in 1:nrep){
    co <- cbind(runif(n, 0, 10), runif(n, 0, 10)); D <- as.matrix(dist(co))
    xs <- rfield(D, range); ys <- rfield(D, range)       # two independent spatial fields
    rej_sp  <- rej_sp  + (summary(lm(ys ~ xs))$coef[2, 4] < alpha)
    xi <- rnorm(n); yi <- rnorm(n)                       # iid control
    rej_iid <- rej_iid + (summary(lm(yi ~ xi))$coef[2, 4] < alpha)
  }
  c(spatial = rej_sp / nrep, iid = rej_iid / nrep)
}
set.seed(2026)
round(100 * type1(nrep = 500, n = 120, range = 2.5), 1)   # percent significant at 0.05
```
The iid control rejects close to five per cent of the time, as a valid test should. The spatial version rejects more than forty per cent of the time. Two fields with no relationship to each other are called significantly correlated almost half the time, because each is internally autocorrelated and the test counts every site as fresh information when it is not. This is the inflation that Clifford, Richardson, and Hemon (1989) characterised, and the practical danger that Dormann and colleagues (2007) review for species data.
## What to do about it
Detecting autocorrelation is the first step. The residual Moran's I above is a check for an ordinary regression fitted by least squares, like the one here; `lm.morantest()` is derived for exactly that case, and a model that already contains spatial terms needs a check designed for it. When the residual test is significant, the model needs to account for the spatial structure rather than ignore it. The options, reviewed by Dormann et al. (2007), include adding the spatial structure as predictors (trend surfaces or spatial eigenvector maps, the `dbMEM` approach), generalised least squares with a spatial correlation function, autoregressive models (`spatialreg` fits simultaneous and conditional autoregressive models; the fitting functions moved there from `spdep`, which now keeps the neighbour and weight tools), and spatial mixed models. Each puts the dependence into the model so the inference is honest again.
Three cautions. Moran's I depends on the neighbour and weight definition, so a different choice of `k`, or distance bands, or weighting gives a different number; report what you used. And for irregular point data, prefer the permutation test (`moran.mc`) over the normal approximation, since the analytic variance leans on assumptions that irregular layouts often break. A third applies to the residual test above: `moran.mc()` and `moran.test()` treat the residuals as raw data, with a null mean of -1/(n - 1), but residuals of a model with smooth predictors have a lower null mean, and with many such predictors both tests reject too rarely. `lm.morantest()`, the `p_lm` column above, uses the residual null, and it is the version to use on a fitted linear model. With the one or two predictors here the two readings agree ([Moran's I on residuals](../morans-i-on-regression-residuals/)).
## References
Moran PAP 1950 Biometrika 37(1-2):17-23 (10.1093/biomet/37.1-2.17)
Clifford P, Richardson S, Hemon D 1989 Biometrics 45(1):123-134 (10.2307/2532039)
Legendre P 1993 Ecology 74(6):1659-1673 (10.2307/1939924)
Dormann CF, McPherson JM, Araujo MB, et al. 2007 Ecography 30(5):609-628 (10.1111/j.2007.0906-7590.05171.x)
Bivand RS, Wong DWS 2018 TEST 27(3):716-748 (10.1007/s11749-018-0599-x)
## Related tutorials
- [Generalised least squares for spatial data in R](../gls-spatial-correlation/)
- [Moran's I on residuals: moran.test or lm.morantest](../morans-i-on-regression-residuals/)
- [Spatial lag and spatial error models (SAR)](../spatial-autoregressive-models-sar/)
- [Join counts for presence-absence maps](../join-counts-for-presence-maps/)