---
title: "R0 and herd immunity"
description: "The reproduction number in R: why an epidemic needs R0 above one, and why immunising a fraction one minus one over R0 of the population stops it spreading."
date: "2026-07-05 12:00"
date-modified: "2026-10-07"
categories: [ecology tutorial, R, disease ecology, theoretical ecology, population models]
image: thumbnail.png
image-alt: "The effective reproduction number falling with the fraction immunised for three pathogens, with basic values of 2, 4 and 10, crossing a dotted line at one further to the right for the more transmissible ones."
---
*Corrected 7 October 2026: the post said that immunity below the threshold only slows an epidemic; the figure title now says it slows the epidemic but does not stop it, and the text adds that the epidemic also reaches a smaller final size. It also said the same threshold governs any disease in any population, which its own final section on random mixing contradicts; it now says the threshold logic applies to disease in wild populations too.*
```{r setup}
#| code-fold: true
#| code-summary: "Setup: packages, colours and plot theme"
#| results: hide
#| message: false
#| warning: false
knitr::opts_chunk$set(echo = TRUE, message = FALSE, warning = FALSE,
                      dev = "png", dpi = 120, fig.path = "figures/",
                      fig.width = 7, fig.height = 4.4)
library(ggplot2)
theme_te <- theme_minimal(base_size = 12) +
  theme(panel.background = element_rect(fill = "#f5f4ee", colour = NA),
        plot.background  = element_rect(fill = "#f5f4ee", colour = NA),
        panel.grid.minor = element_blank(),
        plot.title = element_text(face = "bold", size = 12))
theme_set(theme_te)
col_a <- "#3a6b52"; col_b <- "#b5651d"; col_ref <- "#555555"

R0 <- 4
herd <- 1 - 1/R0
Reff <- function(v, R0) R0*(1 - v)     # effective reproduction number after immunising fraction v
v_crit <- function(R0) 1 - 1/R0
```
The [SIR model](../the-sir-epidemic-model/) said an epidemic needs the basic reproduction number above one. Turn that around and it becomes the most useful idea in disease management: if you can drag the *effective* reproduction number below one, by removing enough susceptibles before the pathogen arrives, the outbreak cannot sustain itself. That is herd immunity, and the fraction you have to protect follows directly from the reproduction number.
## The effective reproduction number
The basic reproduction number counts secondary cases when everyone is susceptible. But a pathogen invading a population where some hosts are already immune meets fewer susceptibles, so each case infects proportionally fewer others. The effective reproduction number is the basic one scaled by the susceptible fraction; immunise a fraction of the population and you cut it by that fraction.
```{r reff}
R0 <- 4
Reff <- function(v) R0*(1 - v)      # v = fraction immunised (or already immune)
c(none = Reff(0), quarter = Reff(0.25), half = Reff(0.5), three_quarters = Reff(0.75))
```
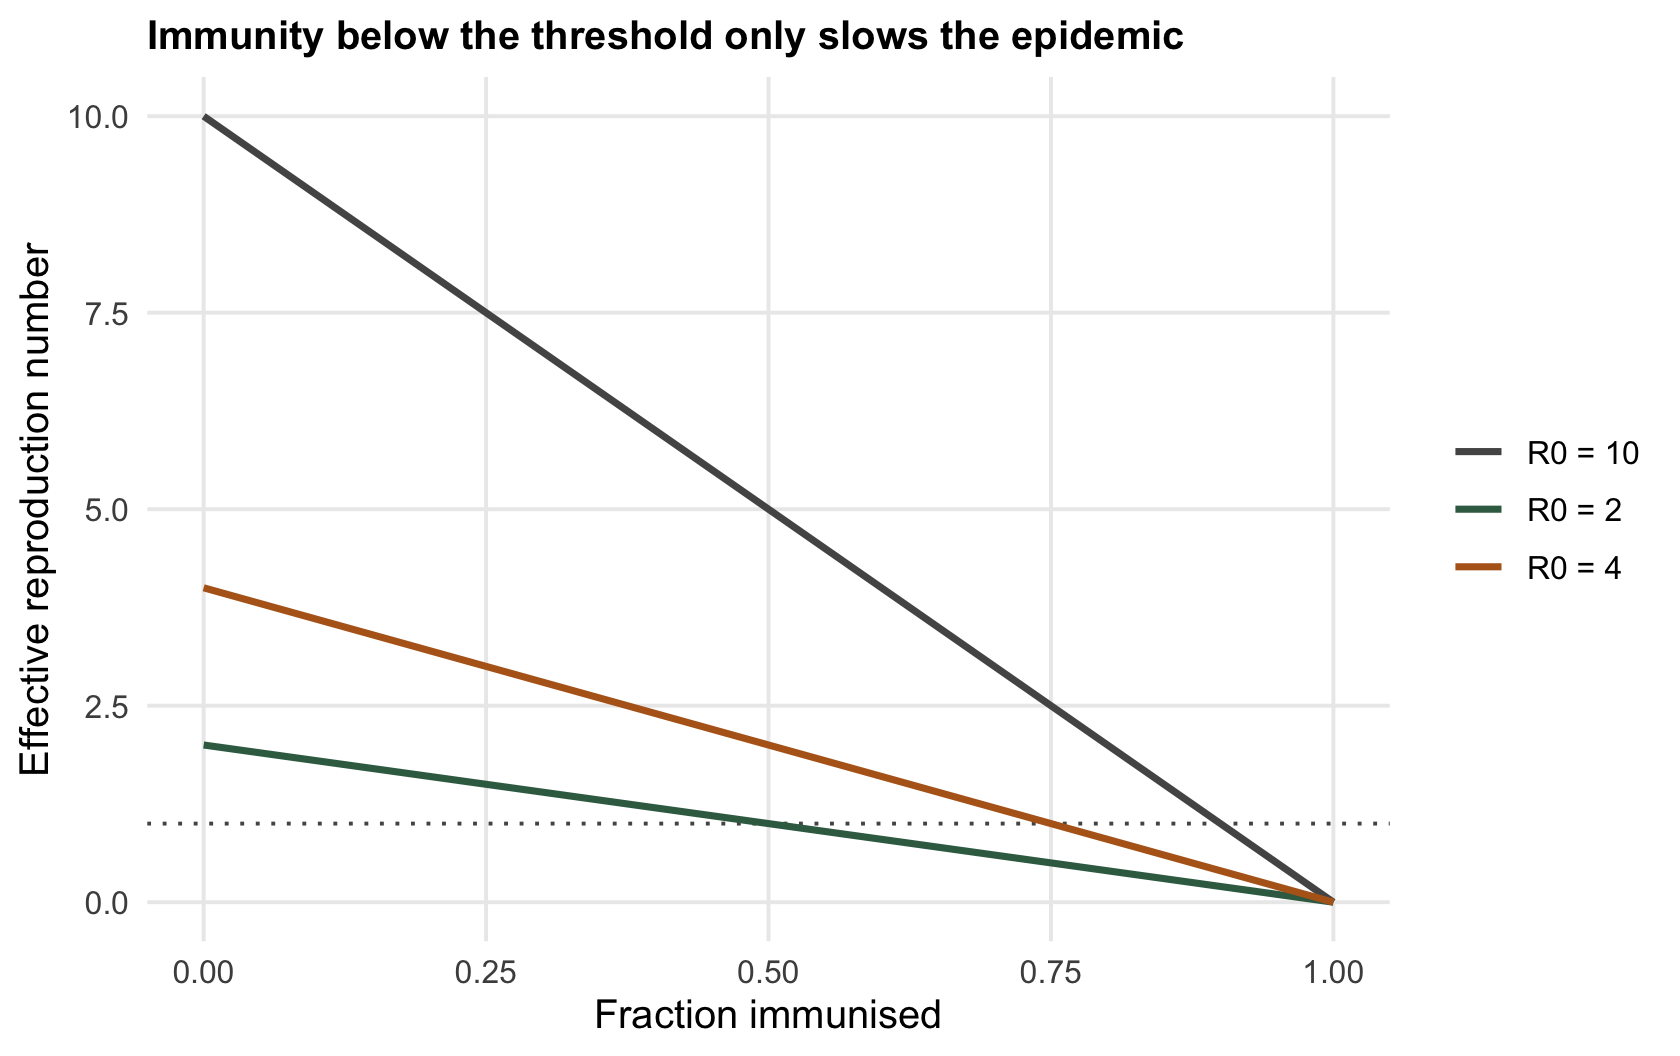
With a basic reproduction number of `r sprintf("%.0f", R0)`, an untouched population has each case seeding four more. Immunise half and each seeds two; the epidemic still grows, but more slowly and to a smaller final size. Immunise three quarters and each case seeds exactly one: the pathogen treads water, neither growing nor shrinking. Push past that and every case seeds fewer than one, the chain of transmission breaks, and the outbreak dies even though most individuals were never touched. That tipping fraction is the herd immunity threshold.
```{r threshold}
v_crit <- function(R0) 1 - 1/R0      # herd immunity threshold
c(R0_2 = v_crit(2), R0_4 = v_crit(4), R0_10 = v_crit(10))
```
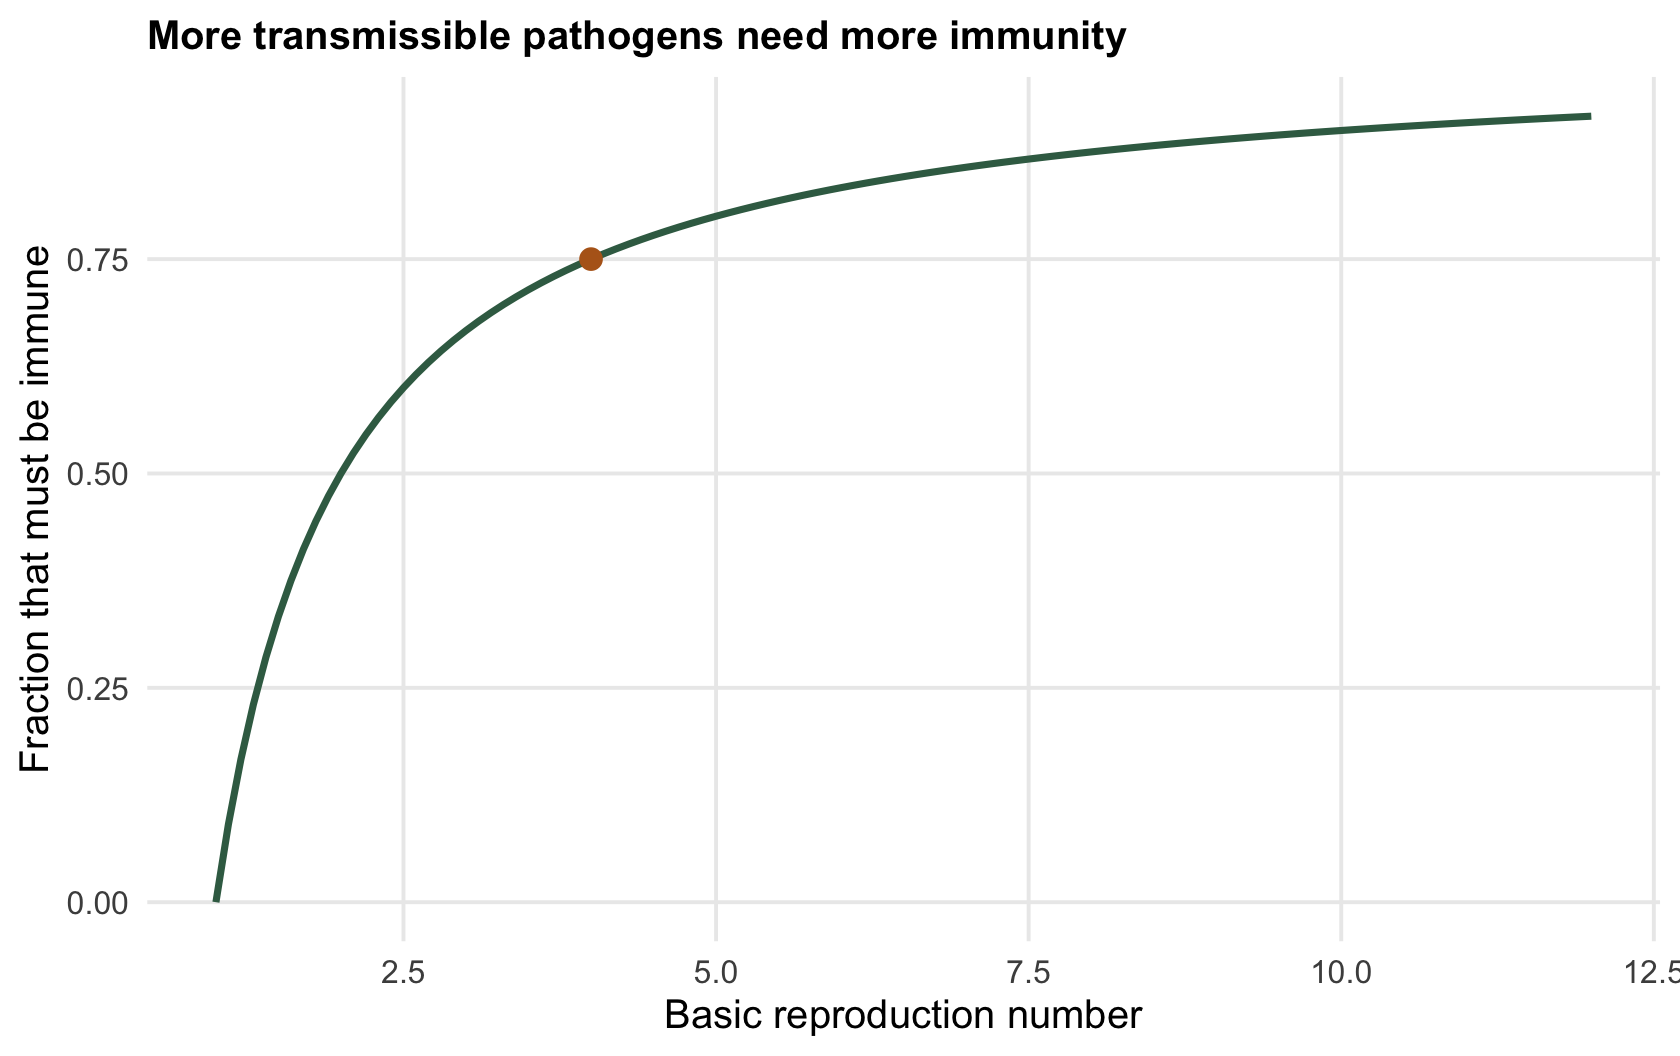
The threshold is one minus one over the reproduction number. For a pathogen with a reproduction number of `r sprintf("%.0f", R0)` it is `r sprintf("%.2f", herd)`: protect three quarters of the population and the remaining quarter is shielded too, because the pathogen can no longer find enough hosts to keep going. The more transmissible the pathogen, the higher the bar: a reproduction number of ten demands ninety per cent coverage.
```{r fig-threshold}
#| fig-cap: "The herd immunity threshold against the basic reproduction number. The fraction that must be immune to stop spread rises steeply for low reproduction numbers and approaches the whole population as transmissibility climbs."
#| fig-alt: "A rising curve of the herd immunity threshold against the reproduction number, climbing quickly then levelling off near the top of the axis."
R0g <- seq(1, 12, 0.1)
dg <- data.frame(R0 = R0g, v = v_crit(R0g))
ggplot(dg, aes(R0, v)) +
  geom_line(colour = col_a, linewidth = 1) +
  geom_point(data = data.frame(R0 = 4, v = herd), aes(R0, v), colour = col_b, size = 2.6) +
  labs(x = "Basic reproduction number", y = "Fraction that must be immune",
       title = "More transmissible pathogens need more immunity")
```
## Where the threshold comes from
The threshold is exactly the point where the effective reproduction number crosses one. Immunising a fraction leaves the reproduction number at the basic value times the susceptible fraction, and setting that equal to one and solving gives the herd immunity threshold. Plot the effective reproduction number against coverage and it is a straight line from the basic value down to zero, crossing one at the threshold.
```{r fig-reff}
#| fig-cap: "The effective reproduction number against the fraction immunised, for three pathogens. Each line falls from its basic value to zero; where it crosses one (dotted) is the herd immunity threshold, further right for more transmissible pathogens."
#| fig-alt: "Three descending lines of effective reproduction number against immunised fraction, each crossing a dotted line at one, with the crossings further right for higher basic reproduction numbers."
vg <- seq(0, 1, 0.01)
dr <- do.call(rbind, lapply(c(2, 4, 10), function(r)
  data.frame(v = vg, Reff = r*(1 - vg), R0 = paste0("R0 = ", r))))
ggplot(dr, aes(v, Reff, colour = R0)) +
  geom_hline(yintercept = 1, colour = col_ref, linetype = "dotted") +
  geom_line(linewidth = 1) +
  coord_cartesian(ylim = c(0, 10)) +
  scale_colour_manual(values = c("R0 = 2" = col_a, "R0 = 4" = col_b, "R0 = 10" = col_ref)) +
  labs(x = "Fraction immunised", y = "Effective reproduction number", colour = NULL,
       title = "Immunity below the threshold slows the epidemic but does not stop it")
```
## Why this matters beyond vaccination
Herd immunity is usually discussed for vaccines, but the same threshold logic applies to disease in wild populations too, which is why it belongs to ecology and not just medicine. In wildlife the immune fraction can come from prior infection sweeping through, and the threshold predicts when a pathogen can re-invade a recovering population: as births and deaths refill the susceptible pool, the effective reproduction number climbs back toward the basic value and the next outbreak becomes possible. That refilling is what turns a one-off epidemic into recurrent or [endemic disease](../host-density-and-endemic-disease/). The threshold also underpins culling and control decisions, though only when the reproduction number is measured correctly, which is harder than it looks and is the [checking post](../checking-an-epidemic-model/). And the whole logic, an invader that needs each unit to more than replace itself, is the same threshold that governs whether a species persists in a [patchy landscape](../the-levins-metapopulation-model/).
## What the threshold assumes
Everything above rests on one quiet assumption: that contacts happen at random, so every susceptible individual is equally likely to meet an infected one. Populations are not like that. A few individuals contact far more others than the average does, and those same individuals are infected earliest and leave the susceptible pool first. When contact rates vary, the infection burns through the best-connected part of the population before it stalls, and the fraction that has to be immune before transmission stops comes out below one minus one over the reproduction number.
That discount applies to immunity acquired by infection, because infection selects whom it reaches. Immunity delivered by a campaign that reaches people at random earns no discount, so the classical threshold is still the right target when you are planning coverage. Heterogeneity also pushes the other way on the reproduction number itself: variance in contact rates raises it above what an average contact rate would give, which the [checking post](../checking-an-epidemic-model/) measures directly in its third check.
## References
- Anderson RM, May RM 1985. Nature 318(6044):323-329 (10.1038/318323a0).
- Fine PEM 1993. Epidemiologic Reviews 15(2):265-302 (10.1093/oxfordjournals.epirev.a036121).
## Related tutorials
- [The SIR epidemic model](../the-sir-epidemic-model/)
- [Host density and endemic disease](../host-density-and-endemic-disease/)
- [Checking an epidemic model](../checking-an-epidemic-model/)
- [Estimating R0 from incidence data](../estimating-r0-from-incidence/)