---
title: "Choosing a dissimilarity index for community data"
description: "Euclidean, Bray-Curtis, Jaccard or Hellinger: how the dissimilarity index you choose reshapes ordination of community data in R, and why double zeros matter."
date: "2026-05-05 12:00"
date-modified: "2026-10-14"
categories: [community ecology, multivariate, vegan, R, ecology tutorial]
image: thumbnail.png
image-alt: "Two thick curves on a plain background with no axes or labels. Both rise steeply from the lower left, level off and dip slightly towards the right; the dark green curve climbs much higher, while the gold one flattens out at a lower level."
---
*Corrected 14 October 2026: the post measured the productivity nuisance against the difference in productivity between sites and concluded that neither index tracks it strongly; it now measures it against the summed productivity of each pair, which raw Euclidean distance tracks strongly and Bray-Curtis does not. It also no longer presents the folded ends of the gradient as a Euclidean defect that the Bray-Curtis ordination avoids, since the Bray-Curtis arch curls back at both ends too, and no longer explains the Jaccard lead by productivity noise in the abundances.*
*Corrected 7 October 2026: the post said that high and low moisture sites mix in the Euclidean ordination; they stay apart, and what the fold does is bring both ends of the gradient back beside mid-gradient sites on the first axis. It also no longer credits the Hellinger result to its Euclidean geometry, a cause that the post's own comparisons do not establish.*
*Corrected 30 September 2026: the post blamed saturation for Euclidean distance trailing the other measures, although the composition measures saturate too; it now says the gap comes from Euclidean distance tracking abundance once sites share no species.*
*Updated 27 September 2026: a new section, Jaccard without binary = TRUE, shows that vegdist computes the quantitative Jaccard index unless binary = TRUE is set, and which analyses then cannot tell it apart from Bray-Curtis.*
Almost every multivariate analysis of community data starts the same way: the site-by-species table is turned into a site-by-site dissimilarity matrix, and everything downstream runs on that matrix. NMDS, PERMANOVA, hierarchical clustering and distance-based RDA all take a dissimilarity as their input. That first step looks like a formality, but it is a modelling choice. Two measures applied to the same table can rank the same pair of sites in opposite orders, and that disagreement propagates straight into the ordination.
This post works through what the common choices actually do to community data: a hand-built example that exposes the core problem, a synthetic gradient that shows it on realistic data, and the downstream effect on an ordination. The whole thing runs on `vegan`.
## The double-zero problem
Start with four species and three sites, built so the answer is obvious by eye.
```{r}
#| message: false
#| warning: false
library(vegan)

toy <- rbind(
  s1 = c(1, 1, 0, 0),
  s2 = c(0, 0, 1, 1),   # shares no species with s1
  s3 = c(4, 4, 0, 0)    # same two species as s1, higher abundance
)
colnames(toy) <- paste0("sp", 1:4)

round(as.matrix(vegdist(toy, "euclidean")), 3)
round(as.matrix(vegdist(toy, "bray")), 3)
```
Site `s1` shares both of its species with `s3` and none with `s2`. Composition says `s1` belongs next to `s3`. Euclidean distance disagrees: it makes `s1` closer to `s2` (`r sprintf("%.3f", as.matrix(vegdist(toy, "euclidean"))["s1", "s2"])`) than to `s3` (`r sprintf("%.3f", as.matrix(vegdist(toy, "euclidean"))["s1", "s3"])`). Bray-Curtis gets it right, putting `s1` next to `s3` (`r sprintf("%.3f", as.matrix(vegdist(toy, "bray"))["s1", "s3"])`) and as far as possible from `s2` (`r sprintf("%.3f", as.matrix(vegdist(toy, "bray"))["s1", "s2"])`).
The reason is what Euclidean distance counts. It adds a squared term for every species and divides by nothing, so the size of the numbers drives the answer: `s1` and `s2` differ by one unit on each of four species, while `s1` and `s3` differ by three units on each of the two species they share. Composition loses to abundance. The joint absences sit in the other pair, sp3 and sp4 being missing from both `s1` and `s3`, and Euclidean distance reads that shared zero as agreement, exactly the way it reads a shared abundance. Bray-Curtis does neither: it ignores species absent from both sites and standardises by the two site totals.
Joint absences are usually uninformative in ecology. Two sites that both lack a wetland sedge are not similar in any useful sense; they simply both sit outside its range. A dissimilarity that reads a shared absence as similarity, the way Euclidean distance does, is measuring the wrong thing. Legendre and Legendre (2012) call this the double-zero problem, and it is the single most important reason raw Euclidean distance is a poor default for species data.
## A gradient with a productivity confound
The toy is rigged, so move to something closer to field data: a coenocline of 50 sites along a moisture gradient, with 40 species placed on Gaussian niches. On top of the compositional gradient sits an independent productivity gradient, so total abundance per site varies for reasons that have nothing to do with which species are present.
```{r}
set.seed(82)
n <- 50; nsp <- 40; peak <- 26
moisture <- sort(runif(n, 0, 1))
prod <- runif(n, 0.55, 2.0)                  # productivity, independent of moisture
opt   <- seq(-0.10, 1.10, length.out = nsp)  # niche optima across the gradient
width <- runif(nsp, 0.055, 0.11)             # narrow niches give sharp turnover

lambda <- prod * outer(moisture, seq_len(nsp),
            function(m, j) peak * exp(-((m - opt[j])^2) / (2 * width[j]^2)))
comm <- matrix(rpois(n * nsp, lambda), n, nsp)
rownames(comm) <- paste0("site", seq_len(n))
colnames(comm) <- paste0("sp", seq_len(nsp))
comm <- comm[, colSums(comm) > 0]

c(sites = nrow(comm), species = ncol(comm),
  pct_zero = round(100 * mean(comm == 0), 1),
  max_abund = max(comm),
  cor_moist_prod = round(cor(moisture, prod), 2))
```
The matrix is 63% zeros, which is normal for community data: narrow niches mean most species are absent from most sites. Productivity is effectively uncorrelated with moisture (r = `r sprintf("%.2f", cor(moisture, prod))`), so it acts as a pure nuisance: a measure that confuses abundance with composition will read it as signal.
This is the realistic version of the toy. Turnover creates double zeros between distant sites, and the productivity gradient makes total abundance vary independently of the thing we care about.
## Four measures, one question
Compute four dissimilarities and ask a simple question of each: does the distance between two sites track how far apart they sit on the moisture gradient?
```{r}
d_eu <- vegdist(comm, "euclidean")
d_bc <- vegdist(comm, "bray")
d_ja <- vegdist(comm, "jaccard", binary = TRUE)
d_he <- vegdist(decostand(comm, "hellinger"), "euclidean")  # Hellinger distance
d_grad <- dist(moisture)
```
Bray-Curtis works on abundances and ignores joint absences. Jaccard is its presence-absence sibling, built only from which species are shared. The Hellinger distance is the Euclidean distance computed after a Hellinger transformation (each row divided by its total, then square-rooted); it keeps the convenient Euclidean geometry while behaving like a composition measure, which is why it is the standard bridge to linear methods such as PCA and RDA (Legendre and Gallagher 2001).
```{r}
#| label: fig-decay
#| fig-cap: "Pairwise dissimilarity against the difference in moisture between two sites, for four indices. Each point is a site pair; the red line is a loess smoother."
#| fig-alt: "Four panels of dissimilarity versus moisture difference. Bray-Curtis, Jaccard and Hellinger form tight curves rising to a plateau; the Euclidean panel is a diffuse cloud whose smoother bends back down at large separations."
#| fig-width: 8
#| fig-height: 5.4
#| message: false
#| warning: false
library(ggplot2); library(dplyr)
pap <- "#f5f4ee"; ink <- "#16241d"; line <- "#dad9ca"
forest <- "#275139"; accent <- "#b5534e"
te_theme <- theme_minimal(base_size = 12) + theme(
  plot.background = element_rect(fill = pap, colour = NA),
  panel.background = element_rect(fill = pap, colour = NA),
  panel.grid.minor = element_blank(),
  panel.grid.major = element_line(colour = line, linewidth = .3),
  axis.title = element_text(colour = ink), axis.text = element_text(colour = "#5d6b61"),
  plot.title = element_text(colour = ink, face = "bold"),
  plot.subtitle = element_text(colour = "#5d6b61"),
  strip.text = element_text(colour = ink, face = "bold"),
  legend.title = element_text(colour = ink), legend.text = element_text(colour = "#5d6b61"))

pairs_tab <- function(dst, label) {
  m <- as.matrix(dst)
  data.frame(grad = as.vector(d_grad), dis = m[lower.tri(m)], metric = label)
}
L <- bind_rows(
  pairs_tab(d_eu, "Euclidean"), pairs_tab(d_bc, "Bray-Curtis"),
  pairs_tab(d_ja, "Jaccard (binary)"), pairs_tab(d_he, "Hellinger"))
L$metric <- factor(L$metric,
  levels = c("Euclidean", "Bray-Curtis", "Jaccard (binary)", "Hellinger"))

ggplot(L, aes(grad, dis)) +
  geom_point(alpha = .15, size = .7, colour = forest) +
  geom_smooth(method = "loess", se = FALSE, colour = accent, linewidth = 1) +
  facet_wrap(~metric, scales = "free_y") +
  labs(x = "Difference in moisture between two sites", y = "Dissimilarity",
       title = "The same site pairs, four dissimilarity indices") +
  te_theme
```
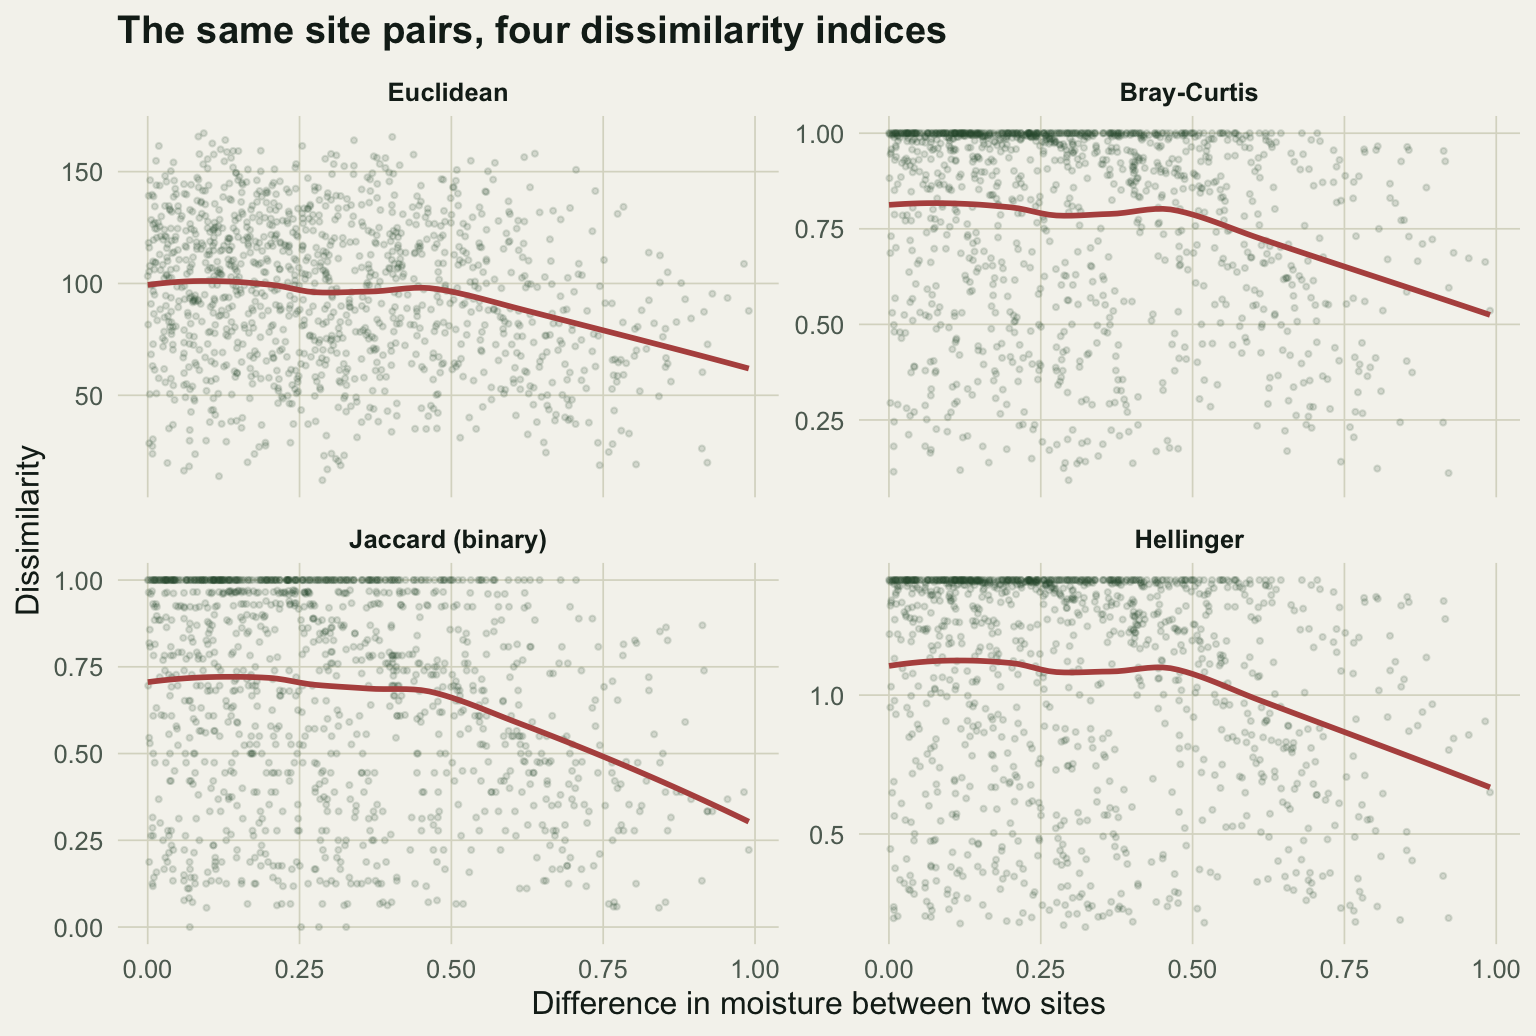
The three composition measures climb cleanly from zero and saturate once two sites stop sharing species. Their smoothers sag slightly at the far right, and the Jaccard one rises just above 1, but that is loess running out of pairs at the end of the range: the points there sit flat on the plateau. Raw Euclidean distance is a diffuse cloud, and its smoother bends back down at large separations: the most different pairs can look closer than moderately different ones. A Mantel correlation against gradient separation puts numbers on the pattern.
```{r}
#| message: false
#| warning: false
mant <- function(d) { set.seed(1); m <- mantel(d, d_grad, permutations = 999)
  c(r = round(m$statistic, 3), p = m$signif) }
rbind(Euclidean = mant(d_eu), `Bray-Curtis` = mant(d_bc),
      `Jaccard (binary)` = mant(d_ja), Hellinger = mant(d_he))
# how strongly does each distance track the productivity nuisance?
d_prod <- as.dist(outer(prod, prod, "+"))   # summed productivity of each pair
prod_r <- c(Euclidean_vs_prod = round({ set.seed(1); mantel(d_eu, d_prod, permutations = 999)$statistic }, 2),
            Bray_vs_prod      = round({ set.seed(1); mantel(d_bc, d_prod, permutations = 999)$statistic }, 2))
prod_r
```
Euclidean distance trails the field at r = 0.605, while the composition measures all sit clearly above it. Saturation alone does not explain the gap, since the composition measures saturate too. What drags Euclidean down is that once two sites share no species, their distance depends on how abundant they are rather than on how far apart they sit, which is why its smoother bends back down at large separations. The second measurement asks whether the raw counts also carry the productivity nuisance into the distance. Because the Euclidean distance between two sites that share no species grows with how abundant both of them are, the yardstick is the summed productivity of each pair rather than the difference: Euclidean distance tracks it strongly (Mantel r = `r format(prod_r[["Euclidean_vs_prod"]], nsmall = 2)`), while Bray-Curtis, which standardises by the two site totals, does not (`r format(prod_r[["Bray_vs_prod"]], nsmall = 2)`).
## The ordination inherits the distance
None of this matters in the abstract. It matters because the dissimilarity is the input to everything downstream. Run principal coordinates analysis (`cmdscale`) on each distance matrix and ask how well the first axis recovers the moisture ordering.
```{r}
#| message: false
#| warning: false
library(tidyr)
p_eu <- cmdscale(d_eu, k = 2, eig = TRUE)
p_bc <- cmdscale(d_bc, k = 2, eig = TRUE)
p_he <- cmdscale(d_he, k = 2, eig = TRUE)
rho <- function(p) abs(cor(p$points[,1], moisture, method = "spearman"))
rho_eu <- rho(p_eu); rho_bc <- rho(p_bc); rho_he <- rho(p_he)
c(Euclidean = round(rho_eu, 2), `Bray-Curtis` = round(rho_bc, 2),
  Hellinger = round(rho_he, 2),
  Bray_negeig_pct = round(100 * abs(sum(p_bc$eig[p_bc$eig < 0]) / sum(abs(p_bc$eig))), 1))
```
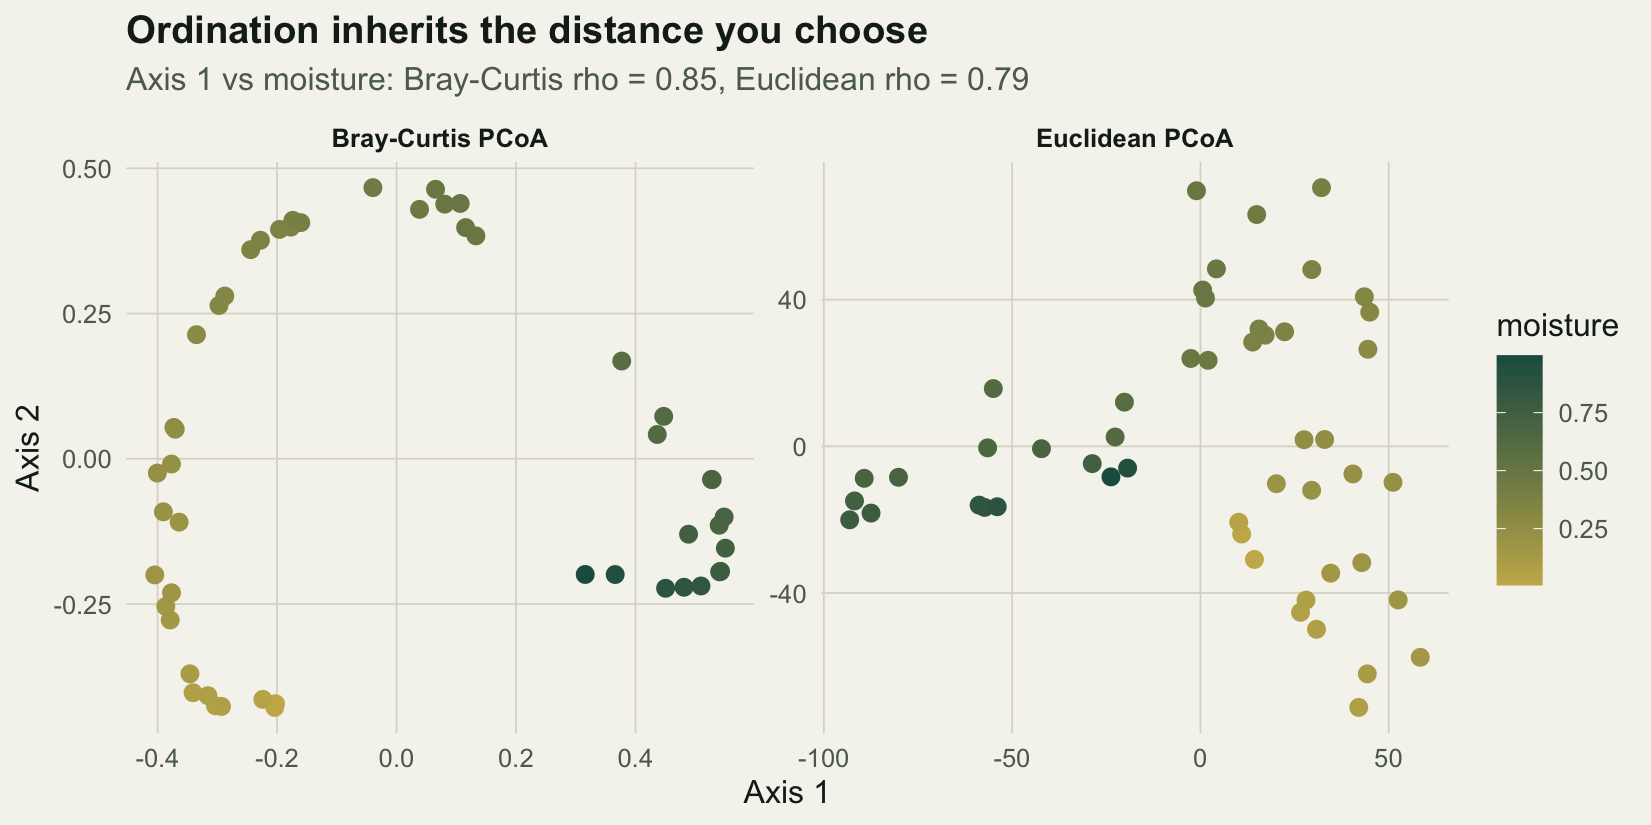
Bray-Curtis recovers the gradient well, Hellinger at least as well, and raw Euclidean trails. The figure shows what that means geometrically.
```{r}
#| label: fig-pcoa
#| fig-cap: "Principal coordinates ordinations of the same community, from Euclidean and Bray-Curtis distances, with sites coloured by moisture."
#| fig-alt: "Two ordination panels coloured by moisture. In both panels the sites form an arch whose ends curl back towards the middle, so on axis 1 the wettest and driest sites sit beside mid-moisture sites; the Bray-Curtis arch is clean, the Euclidean one more scattered."
#| fig-width: 8.6
#| fig-height: 4.3
#| message: false
#| warning: false
mk <- function(p, lab) data.frame(A = p$points[,1], B = p$points[,2],
                                  moisture = moisture, panel = lab)
P <- bind_rows(mk(p_bc, "Bray-Curtis PCoA"), mk(p_eu, "Euclidean PCoA"))

ggplot(P, aes(A, B, colour = moisture)) +
  geom_point(size = 2.6) +
  facet_wrap(~panel, scales = "free") +
  scale_colour_gradient(low = "#c9b458", high = "#1d5b4e", name = "moisture") +
  labs(x = "Axis 1", y = "Axis 2",
       title = "Ordination inherits the distance you choose",
       subtitle = sprintf("Axis 1 vs moisture: Bray-Curtis rho = %.2f, Euclidean rho = %.2f",
                           rho_bc, rho_eu)) +
  te_theme
```
Bray-Curtis lays the sites out as a clean arch, but its ends curl back, so on the first axis the wettest and driest sites sit beside mid-gradient sites; the axis still follows moisture closely (Spearman `r sprintf("%.2f", rho_bc)`). Euclidean distance folds both ends back as well, in a more scattered arch, and the recovery drops to `r sprintf("%.2f", rho_eu)`. The Hellinger distance is at the top of the field (`r sprintf("%.2f", rho_he)`); it works on relative abundances, which strips the abundance nuisance, and it is fully compatible with Euclidean geometry.
That last point is worth holding onto. The Bray-Curtis ordination here carries `r sprintf("%.1f", 100 * abs(sum(p_bc$eig[p_bc$eig < 0]) / sum(abs(p_bc$eig))))`% of its inertia in negative eigenvalues, the signature of a semimetric distance embedded in Euclidean space (the same issue behind the difference between `capscale` and `dbrda`). The Hellinger distance has no such problem: it is Euclidean by construction, so PCA and RDA can be run directly on Hellinger-transformed data, which is exactly how transformation-based ordination works.
## Abundance or incidence?
Bray-Curtis and Jaccard answer slightly different questions. Bray-Curtis weighs abundances; Jaccard sees only which species are shared.
```{r}
round(cor(as.vector(d_bc), as.vector(d_ja)), 2)
```
On this dataset they agree closely (correlation `r sprintf("%.2f", cor(as.vector(d_bc), as.vector(d_ja)))` between the two distance matrices), and Jaccard even edges ahead in the Mantel test. That is not a general result, and it depends on the statistic: the Spearman Mantel r in the next section puts Bray-Curtis slightly ahead. When abundance carries the signal, when communities shift in dominance rather than membership, Bray-Curtis sees a change that Jaccard is blind to. The choice between them is really a question about your data: is abundance signal or nuisance for the question you are asking?
## Jaccard without binary = TRUE
Every Jaccard matrix above was built with `binary = TRUE`, and the switch is not decoration. In `vegdist()` the default is `binary = FALSE` (vegan 2.6-4 here, and the same in the 2.8-0 development source), and then "jaccard" is not the presence-absence index. The help page says what it is instead: "Jaccard index is computed as 2B/(1+B), where B is Bray-Curtis dissimilarity", a quantitative index that the page adds should probably be called the Ruzicka index. This is documented behaviour, not a bug. The trap is the wrappers: `metaMDS(comm, distance = "jaccard")` and `adonis2(comm ~ x, method = "jaccard")` pass the default on unless you add `binary = TRUE` yourself. The chunk reproduces the identity on this community and then runs the usual analyses on three matrices: Bray-Curtis, the default "jaccard", and the binary Jaccard used above.
```{r jaccard-default}
#| message: false
#| warning: false
stopifnot(isFALSE(formals(vegdist)$binary), formals(mantel)$method == "pearson")
d_jq <- vegdist(comm, "jaccard")                      # binary = FALSE by default
stopifnot(max(abs(d_jq - 2 * d_bc / (1 + d_bc))) < 1e-12)
stopifnot(max(abs(vegdist(decostand(comm, "pa"), "jaccard") - d_ja)) < 1e-12)
jq_cor <- c(pearson = cor(d_bc, d_jq), spearman = cor(d_bc, d_jq, method = "spearman"))

three <- list(bc = d_bc, jq = d_jq, ja = d_ja)
zone <- cut(moisture, c(0, 1/3, 2/3, 1), labels = c("dry", "mid", "wet"))
mant_rank <- sapply(three, function(d) mantel(d, d_grad, method = "spearman", permutations = 0)$statistic)
mant_lin  <- sapply(three, function(d) mantel(d, d_grad, permutations = 0)$statistic)
anosim_r  <- sapply(three, function(d) anosim(d, zone, permutations = 0)$statistic)
pcoa_rho  <- sapply(three, function(d) rho(cmdscale(d, k = 2, eig = TRUE)))
perm_r2   <- sapply(three, function(d) adonis2(d ~ moisture, permutations = 0)$R2[1])
stopifnot(isTRUE(all.equal(perm_r2[["jq"]],
  adonis2(comm ~ moisture, method = "jaccard", permutations = 0)$R2[1])))

# the NMDS wrapper as it is usually called (autotransform on, default tries)
set.seed(3); nm_bc <- metaMDS(comm, distance = "bray", trace = FALSE)
set.seed(3); nm_jq <- metaMDS(comm, distance = "jaccard", trace = FALSE)
set.seed(3); nm_ja <- metaMDS(comm, distance = "jaccard", binary = TRUE, trace = FALSE)
nm_stress <- c(bc = nm_bc$stress, jq = nm_jq$stress, ja = nm_ja$stress)
procr_r <- c(bc = NA, jq = protest(nm_bc, nm_jq, permutations = 0)$t0,
             ja = protest(nm_bc, nm_ja, permutations = 0)$t0)
# metaMDS ends with a half-change scaling, which reads the dissimilarity values
stopifnot(isTRUE(attr(nm_bc$points, "halfchange")), isTRUE(attr(nm_jq$points, "halfchange")))
nm_scale <- sd(nm_jq$points) / sd(nm_bc$points)
stopifnot(pcoa_rho[["ja"]] > max(rho_eu, rho_bc, rho_he, pcoa_rho[["jq"]]))

# NMDS reads only ranks: from one shared start the two fits coincide
md_b <- metaMDSdist(comm, "bray", noshare = FALSE, trace = FALSE)
md_j <- metaMDSdist(comm, "jaccard", noshare = FALSE, trace = FALSE)
stopifnot(max(abs(md_j - 2 * md_b / (1 + md_b))) < 1e-12)
start_cfg <- cmdscale(md_b, k = 2)
start_r <- protest(start_cfg, cmdscale(md_j, k = 2), permutations = 0)$t0
same_start_gap <- max(abs(monoMDS(md_b, y = start_cfg)$points - monoMDS(md_j, y = start_cfg)$points))
stopifnot(same_start_gap < 1e-10)

jq_tab <- rbind(`Spearman Mantel r` = mant_rank, `ANOSIM R, moisture thirds` = anosim_r,
  `NMDS stress` = nm_stress, `Procrustes r to Bray NMDS` = procr_r,
  `Pearson Mantel r` = mant_lin, `PCoA axis 1 rho` = pcoa_rho, `PERMANOVA R2` = perm_r2)
colnames(jq_tab) <- c("Bray-Curtis", "jaccard (default)", "Jaccard (binary)")
round(jq_tab, 4)
```
Because 2B/(1+B) only ever rises with B, the default "jaccard" puts every site pair in the same order as Bray-Curtis: their Spearman correlation is `r sprintf("%.4f", jq_cor[["spearman"]])`, while the Pearson correlation is `r sprintf("%.3f", jq_cor[["pearson"]])` because the curve bends. Any analysis that reads only the ranks of the dissimilarities therefore returns the Bray-Curtis numbers. The Spearman Mantel r is `r sprintf("%.4f", mant_rank[["bc"]])` for both (binary Jaccard `r sprintf("%.4f", mant_rank[["ja"]])`), and ANOSIM R across dry, mid and wet thirds is `r sprintf("%.4f", anosim_r[["bc"]])` for both (binary `r sprintf("%.4f", anosim_r[["ja"]])`). `metaMDS()` begins its search from a PCoA of the (transformed) matrix, and the two starting PCoAs differ (Procrustes r `r sprintf("%.4f", start_r)`), yet the two searches end at stress `r sprintf("%.4f", nm_stress[["bc"]])` and `r sprintf("%.4f", nm_stress[["jq"]])`, with a Procrustes correlation of `r sprintf("%.4f", procr_r[["jq"]])` between the configurations (binary Jaccard: `r sprintf("%.4f", procr_r[["ja"]])`). The shape is shared, the axis units are not: `metaMDS()` finishes with a half-change scaling that reads the dissimilarity values, so the default "jaccard" axes come out `r sprintf("%.2f", nm_scale)` times longer than the Bray-Curtis ones, and the printed scores differ. Started from one shared configuration, the two monoMDS fits are the same fit: the chunk checks that no coordinate differs by more than $10^{-10}$. This is the rank-only reading that [NMDS ordination](../nmds-ordination/) relies on, applied to the index itself.
Methods that use the dissimilarity values themselves give three different answers. The Pearson Mantel r, the default in `mantel()` and the statistic `mant()` reported above (see [Mantel tests](../mantel-tests-distance-correlation/)), is `r sprintf("%.3f", mant_lin[["bc"]])` for Bray-Curtis, `r sprintf("%.3f", mant_lin[["jq"]])` for the default "jaccard" and `r sprintf("%.3f", mant_lin[["ja"]])` for the binary index. PCoA axis 1 tracks moisture at `r sprintf("%.3f", pcoa_rho[["bc"]])`, `r sprintf("%.3f", pcoa_rho[["jq"]])` and `r sprintf("%.3f", pcoa_rho[["ja"]])` (the binary index was not in the PCoA comparison above; on this community it recovers moisture better than all three measures there, Hellinger's `r sprintf("%.2f", rho_he)` included), and the PERMANOVA R2 for moisture (the `adonis2()` of [PERMANOVA with envfit](../envfit-and-permanova/)) is `r sprintf("%.3f", perm_r2[["bc"]])`, `r sprintf("%.3f", perm_r2[["jq"]])` and `r sprintf("%.3f", perm_r2[["ja"]])`. So for these metric methods a "jaccard" analysis run without the switch is neither the presence-absence analysis nor the Bray-Curtis one. The fix is one argument: write `binary = TRUE` wherever you mean incidence, inside `metaMDS()` and `adonis2()` as well as `vegdist()`, or convert the table first with `decostand(comm, "pa")`, which the chunk checks gives the same matrix.
## What to reach for
For abundance community data, Bray-Curtis is the sensible default, or the Hellinger distance when you want a Euclidean-embeddable measure for a linear method. For presence-absence data, Jaccard or Sorensen. Raw Euclidean distance on raw counts is the option to avoid, because it reads joint absences as similarity and conflates abundance with composition. If a method forces Euclidean geometry on you, as PCA and RDA do, transform the data first: that is precisely what the Hellinger and chord transformations are for. The dissimilarity is not a preliminary detail. It is the first model you fit, and the rest of the analysis can only be as sound as that choice.
The companion posts pick up directly from here: [NMDS ordination](../nmds-ordination/) and [PERMANOVA with envfit](../envfit-and-permanova/) both start from a Bray-Curtis matrix, [beta diversity partitioning](../beta-diversity-partitioning/) decomposes Sorensen dissimilarity, and [capscale versus dbrda](../capscale-vs-dbrda/) takes up the negative-eigenvalue problem in detail.
## References
Bray & Curtis 1957 Ecological Monographs 27(4):325-349 (10.2307/1942268)
Faith, Minchin & Belbin 1987 Vegetatio 69:57-68 (10.1007/BF00038687)
Legendre & Gallagher 2001 Oecologia 129:271-280 (10.1007/s004420100716)
Legendre & Legendre 2012 Numerical Ecology, 3rd English edition, Elsevier, Developments in Environmental Modelling 24 (ISBN 978-0-444-53868-0)
## Related tutorials
- [NMDS ordination](../nmds-ordination/)
- [Power for a community study](../power-for-a-community-study/)
- [Constrained ordination with dbRDA](../constrained-ordination-dbrda/)
- [Beta diversity as variance: LCBD and SCBD](../beta-diversity-as-variance/)