---
title: "Pseudoreplication: GLMMs for nested counts in R"
description: "Why nesting plots within sites breaks a Poisson GLM's independence, how a random intercept fixes it, and what intraclass correlation and partial pooling mean."
date: "2026-05-04 11:00"
categories: [R, mixed models, GLMM, count data, lme4, ecology tutorial]
image: thumbnail.png
image-alt: "Coefficient plot showing a plain GLM giving a far-too-narrow confidence interval for a site-level predictor compared with a mixed model."
date-modified: "2026-10-15"
---
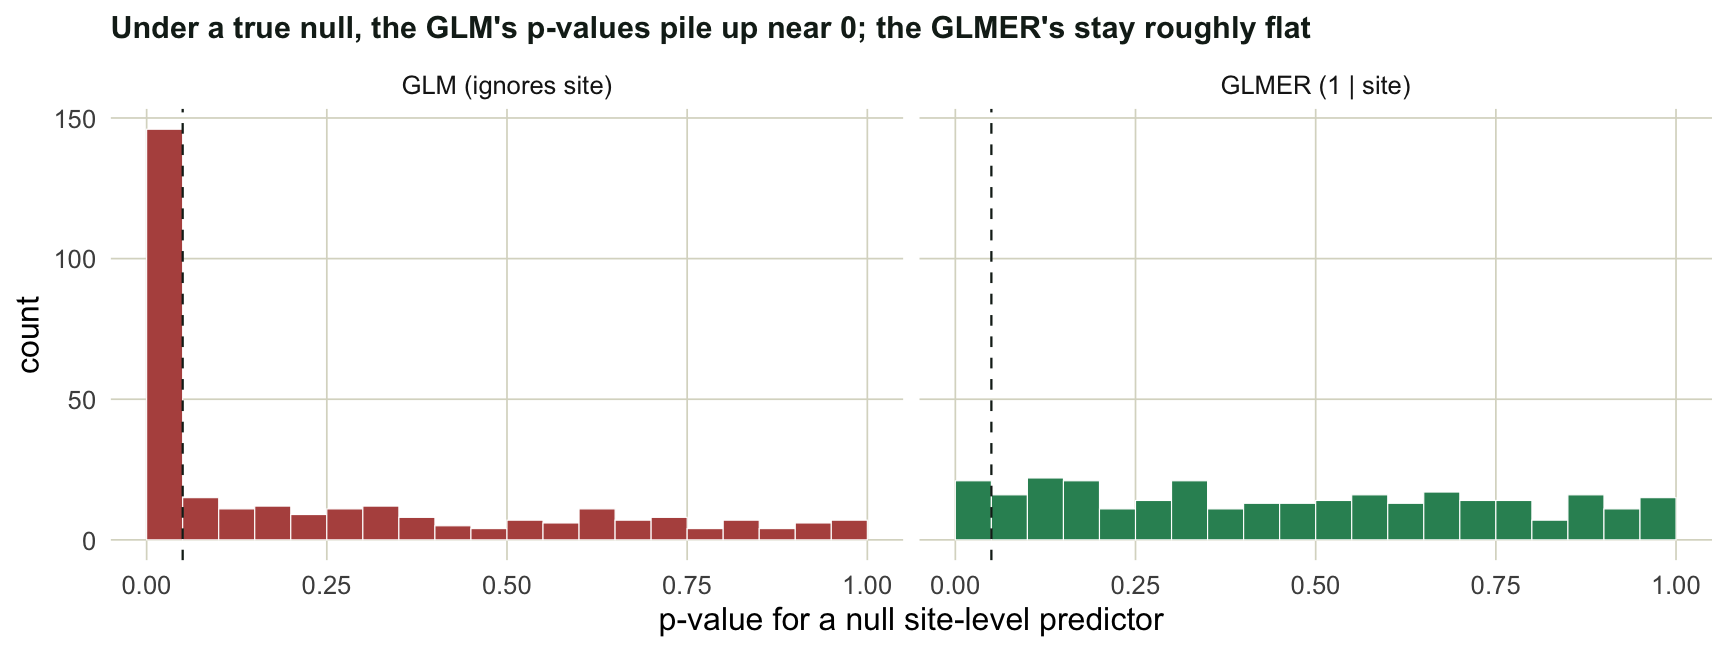
*Corrected 15 October 2026: the post read the mixed model's false-positive rate from a few hundred simulated repeats as close to the nominal rate and its overshoot as noise; the simulation now runs longer and shows the mixed model's Wald test rejecting a true null clearly more often than it should, though far less often than the plain GLM, and the text and the histogram's alt text now say so.*
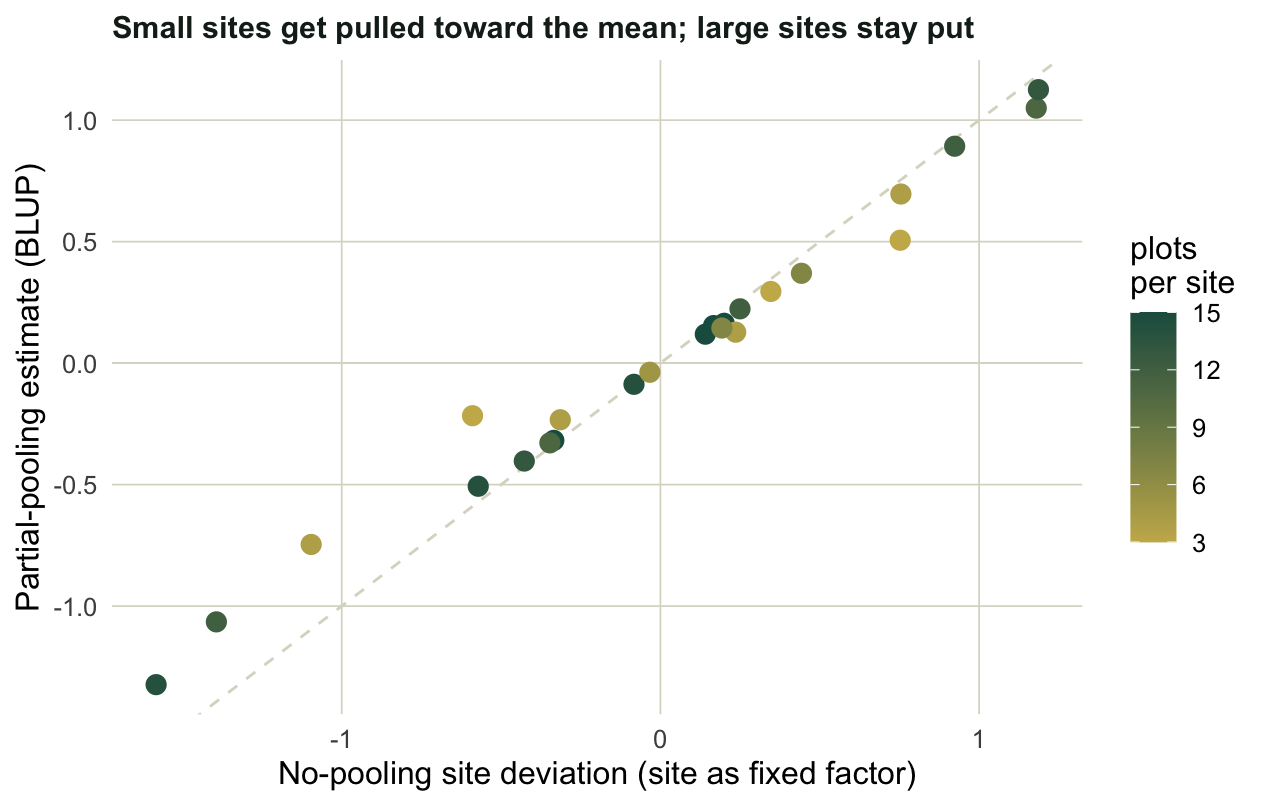
*Corrected 7 October 2026: the post said the sites with a dozen plots or more all hold their ground under partial pooling; two of them, with many plots but few seedlings, are pulled in noticeably too, because for counts the information a site carries depends on how many individuals were seen, and the text and the shrinkage plot title now say so.*
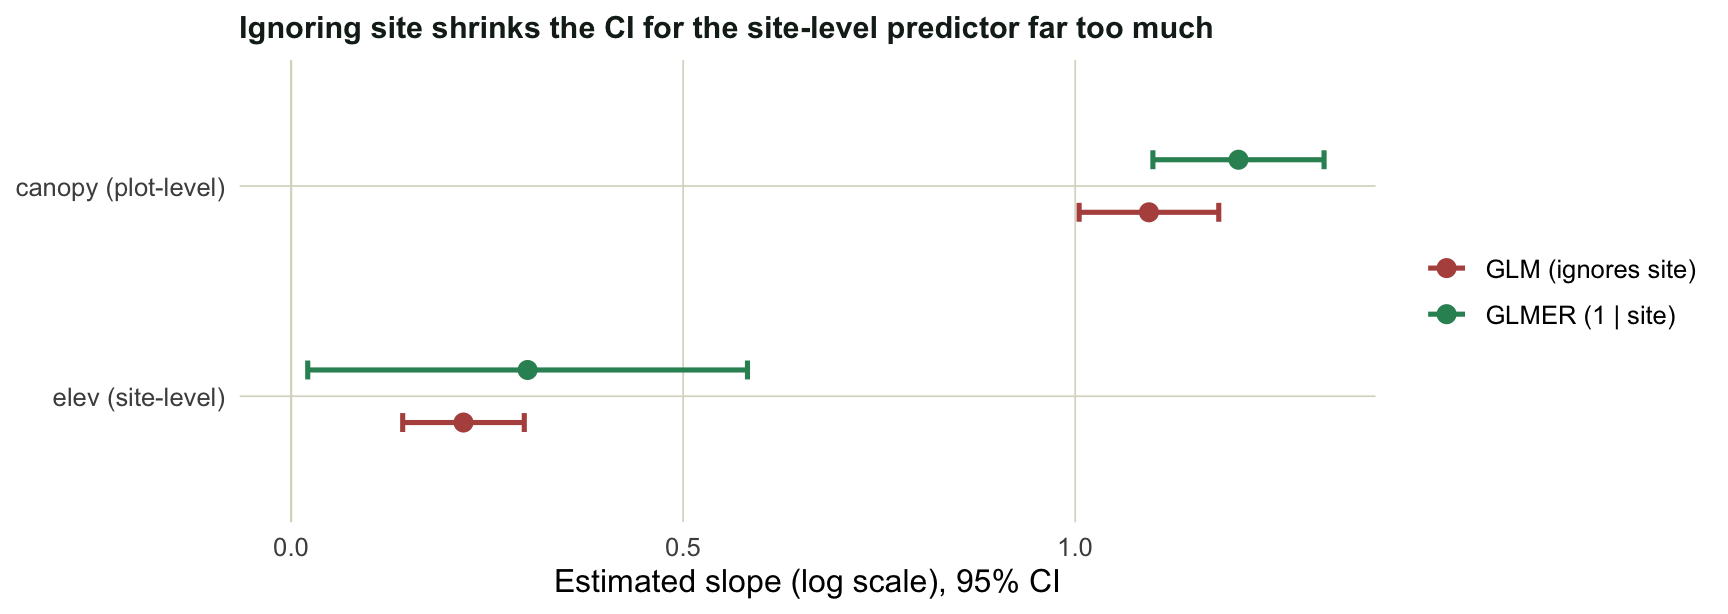
*Corrected 27 September 2026: the post said the point estimates barely move between the plain GLM and the mixed model; they shift (canopy from 1.09 to 1.21, elev from 0.22 to 0.30), and the text and the coefficient-plot caption now say so.*
Ecological count data rarely arrives as a flat list of independent observations. You count seedlings in several plots per site, across many sites; you revisit each transect a few times; you sample several leaves per tree. Observations that share a group resemble each other more than observations from different groups, and that breaks the independence assumption sitting underneath an ordinary [Poisson GLM](../glm-count-data-abundance/). Ignore it and you get pseudoreplication: standard errors that are too small and p-values that are too sure of themselves (Hurlbert 1984). The standard fix is a random intercept, fitted as a generalised linear mixed model with `lme4`.
## When observations share a group
We simulate a survey with a familiar structure: many sites, each holding an unequal number of plots. Two things drive the counts. `canopy` openness varies from plot to plot **within** a site. `elev` is a property of the site itself, so every plot in a site carries the same value. On top of these, each site has its own baseline abundance, drawn at random: that is the random intercept.
```{r}
#| label: setup
#| message: false
#| warning: false
library(lme4)
library(ggplot2)
te_canvas <- theme(plot.background  = element_rect(fill = "#f5f4ee", colour = NA),
                   panel.background = element_rect(fill = "#f5f4ee", colour = NA))

pal_a <- "#b5534e"; pal_b <- "#2f8f63"; pal_lo <- "#c9b458"; pal_hi <- "#1d5b4e"
ink <- "#16241d"; gline <- "#dad9ca"
th <- theme_minimal(base_size = 12) + te_canvas +
  theme(panel.grid.minor = element_blank(),
        panel.grid.major = element_line(color = gline, linewidth = 0.3),
        plot.title = element_text(face = "bold", size = 11.5, color = ink),
        legend.position = "right")

set.seed(2024)
S  <- 24                                    # sites
Ps <- sample(3:15, S, replace = TRUE)       # unequal plots per site (3 to 15)
site <- factor(rep(seq_len(S), Ps))
N <- length(site)

a      <- rnorm(S, 0, 0.7)                   # site random intercept (log scale), sigma = 0.7
elev_s <- rnorm(S, 0, 1)                      # site-level predictor: one value per site
canopy <- rnorm(N, 0, 1)                      # plot-level predictor: varies within a site
elev   <- elev_s[as.integer(site)]
count  <- rpois(N, exp(0.3 + 1.2 * canopy + 0.5 * elev + a[as.integer(site)]))

d <- data.frame(count, canopy, elev, site)
c(N = N, sites = S, plots_min = min(Ps), plots_max = max(Ps), mean_count = round(mean(count), 1))
```
## The pooled GLM is overconfident
Fit the same fixed-effects structure two ways: a plain GLM that treats all `r N` plots as independent, and a GLMM that adds a random intercept for `site`.
```{r}
#| label: fit
#| message: false
#| warning: false
m_glm   <- glm(count ~ canopy + elev, family = poisson, data = d)
m_glmer <- glmer(count ~ canopy + elev + (1 | site), family = poisson, data = d)

cg <- summary(m_glm)$coefficients
ce <- summary(m_glmer)$coefficients
comp <- data.frame(
  predictor = c("canopy (plot-level)", "elev (site-level)"),
  glm_est   = round(cg[c("canopy","elev"), 1], 3),
  glm_se    = round(cg[c("canopy","elev"), 2], 3),
  glmer_est = round(ce[c("canopy","elev"), 1], 3),
  glmer_se  = round(ce[c("canopy","elev"), 2], 3),
  se_ratio  = round(ce[c("canopy","elev"), 2] / cg[c("canopy","elev"), 2], 1),
  row.names = NULL)
comp
```
```{r}
#| label: fig-coef
#| message: false
#| warning: false
#| fig-width: 9
#| fig-height: 3.2
#| fig-cap: "Slope estimates with 95% confidence intervals. For the plot-level predictor the two intervals have similar widths, with the mixed model's estimate a little higher; for the site-level predictor the plain GLM's interval is far too narrow."
#| fig-alt: "Coefficient plot of two slope estimates with confidence intervals; for the plot-level predictor the intervals have similar widths and the mixed model's estimate sits a little higher, but the plain GLM's interval for the site-level predictor is far narrower than the mixed model's."
ci <- function(co, meth) data.frame(term = c("canopy","elev"),
  est = co[c("canopy","elev"), 1], se = co[c("canopy","elev"), 2], method = meth)
cd <- rbind(ci(cg, "GLM (ignores site)"), ci(ce, "GLMER (1 | site)"))
cd$lo <- cd$est - 1.96 * cd$se; cd$hi <- cd$est + 1.96 * cd$se
cd$term <- factor(cd$term, levels = c("elev","canopy"),
                  labels = c("elev (site-level)","canopy (plot-level)"))

ggplot(cd, aes(est, term, color = method)) +
  geom_vline(xintercept = 0, color = gline, linewidth = 0.4) +
  geom_errorbar(aes(xmin = lo, xmax = hi), orientation = "y", width = 0.18, linewidth = 0.9,
                position = position_dodge(0.5)) +
  geom_point(size = 2.8, position = position_dodge(0.5)) +
  scale_color_manual(values = c("GLM (ignores site)" = pal_a, "GLMER (1 | site)" = pal_b),
                     name = NULL) +
  labs(x = "Estimated slope (log scale), 95% CI", y = NULL,
       title = "Ignoring site shrinks the CI for the site-level predictor far too much") + th
```
The point estimates shift (`canopy` from `r sprintf("%.2f", cg["canopy", 1])` to `r sprintf("%.2f", ce["canopy", 1])`, `elev` from `r sprintf("%.2f", cg["elev", 1])` to `r sprintf("%.2f", ce["elev", 1])`), and both mixed-model estimates sit just outside the plain GLM's intervals. The bigger difference is in the uncertainty. For `canopy`, which varies inside each site, the random intercept widens the standard error only slightly: a within-site comparison is already clean, because it is made against the site's own baseline. For `elev`, which is constant within a site, the standard error grows by a factor of `r comp$se_ratio[2]`. The plain GLM counts every plot as an independent piece of evidence about that site's `elev` value, so with about ten plots per site on average it believes it has roughly ten times the information it really has. That is pseudoreplication in one number: the GLM treats `elev` as overwhelmingly significant, while the honest mixed model, with a standard error more than three times larger, leaves the same effect only just significant.
## How much variation lives between sites
The random intercept is not just a correction; it is an estimate worth reading. Its variance tells you how much of the leftover variation is between sites rather than within them.
```{r}
#| label: icc
#| message: false
#| warning: false
vc   <- as.data.frame(VarCorr(m_glmer))
sig2 <- vc$vcov[vc$grp == "site"]
icc  <- sig2 / (sig2 + log(1 + 1 / mean(count)))     # latent scale, lognormal approximation
icc_tri <- sig2 / (sig2 + trigamma(mean(count)))     # latent scale, trigamma variance
icc_delta <- sig2 / (sig2 + 1 / mean(count))     # latent scale, delta method
disp <- sum(residuals(m_glmer, "pearson")^2) / df.residual(m_glmer)
c(sigma_site    = round(sqrt(sig2), 3),
  icc_lognormal = round(icc, 3),
  icc_delta     = round(icc_delta, 3),
  icc_trigamma  = round(icc_tri, 3),
  dispersion    = round(disp, 2))
```
```{r}
#| label: icc-scalars
sigma_site <- sqrt(sig2)
fold_site  <- exp(sigma_site)
```
The between-site standard deviation lands near `r sprintf("%.2f", sigma_site)` on the log scale, so typical sites differ in baseline abundance by roughly `exp(`r sprintf("%.2f", sigma_site)`)`, about `r sprintf("%.1f", fold_site)`-fold. The intraclass correlation has no single value on the latent scale: it depends on which approximation you use for the Poisson variance carried onto the log scale. The lognormal approximation, the one on the first ICC line above, gives `r round(icc, 2)`; the trigamma form recommended for a log link by Nakagawa, Johnson and Schielzeth (2017) gives `r round(icc_tri, 2)`, and a delta-method version sits between them at `r round(icc_delta, 2)`. The three agree when counts are high and drift apart as the mean count gets small, so quote an ICC with the approximation named rather than as a bare figure. Whichever you take, the grouping here is strong, and this is exactly the situation where pretending the plots are independent does the most damage. The Pearson dispersion sits near `r sprintf("%.1f", disp)`, close to the value of 1 that a Poisson GLMM assumes, so nothing here calls for a negative-binomial or observation-level random effect (the [count GLM post](../glm-count-data-abundance/) covers that path).
## Partial pooling and shrinkage
A mixed model does not estimate each site in isolation, and it does not lump them all together either. It does something in between, called partial pooling: each site's estimate is pulled toward the overall mean, and sites with less data are pulled harder, because their own counts are less trustworthy.
```{r}
#| label: fig-shrinkage
#| message: false
#| warning: false
#| fig-width: 6.6
#| fig-height: 4.2
#| fig-cap: "Each site's deviation estimated two ways. No pooling fits every site separately; partial pooling (the BLUP) pulls estimates toward 0, and small sites move most."
#| fig-alt: "Each site's deviation plotted two ways, with the partial-pooling estimates pulled in toward zero relative to the no-pooling ones, and the smallest sites moving the most."
m_sh <- glmer(count ~ canopy + (1 | site), family = poisson, data = d)
blup <- ranef(m_sh)$site[, 1]
m_np <- glm(count ~ canopy + factor(site) - 1, family = poisson, data = d)
sc   <- coef(m_np)[grep("factor", names(coef(m_np)))]
np_dev <- sc - mean(sc)
gs <- as.integer(table(site))
sh <- data.frame(np_dev, blup, gs)

ggplot(sh, aes(np_dev, blup, color = gs)) +
  geom_abline(slope = 1, intercept = 0, color = gline, linewidth = 0.5, linetype = 2) +
  geom_hline(yintercept = 0, color = gline, linewidth = 0.3) +
  geom_point(size = 3) +
  scale_color_gradient(low = pal_lo, high = pal_hi, name = "plots\nper site") +
  labs(x = "No-pooling site deviation (site as fixed factor)",
       y = "Partial-pooling estimate (BLUP)",
       title = "Small sites get pulled toward the mean; most large sites stay put") + th
```
Points on the dashed line would mean no shrinkage at all. Instead the pale points, the sites with only three or four plots, sit inside the line, dragged toward 0, while most of the dark points with a dozen plots or more hold their ground. The two dark points at the far left are the exceptions: those sites have many plots but few seedlings, and for counts the information a site carries depends on how many individuals were seen, not only on how many plots. This is partial pooling borrowing strength across the survey: a site with three noisy plots is told to look a little more like everyone else, which usually improves the prediction for that site.
## The cost of ignoring it: a type-I check
The clearest way to feel the danger is to simulate a true null and see how often each method cries wolf. We generate grouped data where a site-level predictor has no effect at all, fit both models, and record the p-value for that predictor. Over many repeats, a well-behaved test should reject at the nominal rate of 0.05.
```{r}
#| label: typeI
#| message: false
#| warning: false
sim1 <- function(seed) {
  set.seed(seed)
  S <- 15; P <- 8; site <- factor(rep(1:S, each = P)); N <- S * P
  a <- rnorm(S, 0, 0.7); z <- rnorm(S)[as.integer(site)]   # null site-level predictor
  y <- rpois(N, exp(0.4 + a[as.integer(site)]))            # z has no effect
  dd <- data.frame(y, z, site)
  pg <- tryCatch(summary(glm(y ~ z, family = poisson, data = dd))$coefficients["z", 4],
                 error = function(e) NA)
  pm <- tryCatch(suppressWarnings(suppressMessages(
        summary(glmer(y ~ z + (1 | site), data = dd, family = poisson))$coefficients["z", 4])),
        error = function(e) NA)
  c(glm = pg, glmer = pm)
}
R <- 2000
ps <- as.data.frame(t(vapply(1:R, sim1, numeric(2))))
c(GLM_false_positive = round(mean(ps$glm   < 0.05, na.rm = TRUE), 3),
  GLMER_false_positive = round(mean(ps$glmer < 0.05, na.rm = TRUE), 3))
```
```{r}
#| label: fig-typeI
#| message: false
#| warning: false
#| fig-width: 9
#| fig-height: 3.4
#| fig-cap: "Distribution of p-values for a predictor that genuinely does nothing. A calibrated test gives a flat histogram; the GLM is anything but."
#| fig-alt: "Histogram of p-values for a null predictor: the mixed model gives a roughly flat distribution with a raised first bar, while the plain GLM piles up at small p-values."
pl <- rbind(data.frame(p = ps$glm,   method = "GLM (ignores site)"),
            data.frame(p = ps$glmer, method = "GLMER (1 | site)"))
ggplot(pl, aes(p, fill = method)) +
  geom_histogram(breaks = seq(0, 1, 0.05), color = "white", linewidth = 0.2) +
  geom_vline(xintercept = 0.05, color = ink, linetype = 2, linewidth = 0.4) +
  scale_fill_manual(values = c("GLM (ignores site)" = pal_a, "GLMER (1 | site)" = pal_b),
                    guide = "none") +
  facet_wrap(~method) +
  labs(x = "p-value for a null site-level predictor", y = "count",
       title = "Under a true null, the GLM's p-values pile up near 0; the GLMER's stay roughly flat") + th
```
The plain GLM rejects the null around `r sprintf("%.0f%%", 100 * mean(ps$glm < 0.05, na.rm = TRUE))` of the time, nearly ten times the rate it should, and its p-values heap up against 0. The mixed model lands near `r sprintf("%.2f", mean(ps$glmer < 0.05, na.rm = TRUE))`, far closer to the target but still above it, with a much flatter histogram. That overshoot is not noise: with `r R` repeats, the Monte Carlo standard error of a rejection rate near 0.05 is only about `r sprintf("%.3f", sqrt(0.05 * 0.95 / R))`. Wald tests for mixed models run liberal when the number of groups is modest, as it is here with 15 sites, so the random intercept removes most of the overconfidence but not all of it. The fix is the same family of remedy as in the [spatial autocorrelation post](../spatial-autocorrelation-morans-i/): when observations are not independent, model the dependence rather than assuming it away.
## Practical notes
Treat a factor as **random** when its levels are an exchangeable sample from a larger population you want to generalise to (sites, individuals, blocks) and there are enough of them, say five or more, to estimate a variance. Treat it as **fixed** when the levels are few and specifically of interest (two treatments, three years you care about by name). Always check dispersion after fitting; if the Pearson statistic runs well above 1, move to a negative-binomial GLMM or add an observation-level random effect (Harrison et al. 2018). Lean on the variance components and the ICC to describe your design, not just to pass a test. And remember that the Wald p-values printed by `summary` are approximate: for a result near the line, prefer a likelihood-ratio test or a profile or bootstrap confidence interval, and read the modelling guidance in Bolker et al. (2009).
## References
Bates D, Maechler M, Bolker B and Walker S 2015 Journal of Statistical Software 67(1):1-48 (10.18637/jss.v067.i01)
Hurlbert SH 1984 Ecological Monographs 54(2):187-211 (10.2307/1942661)
Bolker BM, Brooks ME, Clark CJ, Geange SW, Poulsen JR, Stevens MHH and White J-SS 2009 Trends in Ecology and Evolution 24(3):127-135 (10.1016/j.tree.2008.10.008)
Harrison XA, Donaldson L, Correa-Cano ME, Evans J, Fisher DN, Goodwin CED, Robinson BS, Hodgson DJ and Inger R 2018 PeerJ 6:e4794 (10.7717/peerj.4794)
Nakagawa S, Johnson PCD and Schielzeth H 2017 Journal of the Royal Society Interface 14(134):20170213 (10.1098/rsif.2017.0213)
## Related tutorials
- [Pseudoreplication in ecology](../pseudoreplication-in-ecology/)
- [Random slopes in mixed models](../random-slopes-mixed-models/)
- [Nested and crossed random effects in lme4](../nested-and-crossed-random-effects/)
- [GEE or a mixed model? Marginal and conditional](../gee-or-a-mixed-model/)