library(vegan)
library(ggplot2)

theme_te <- function(base_size = 12) {
  theme_minimal(base_size = base_size) +
    theme(
      plot.background  = element_rect(fill = "#f5f4ee", colour = NA),
      panel.background = element_rect(fill = "#f5f4ee", colour = NA),
      panel.grid.major = element_line(colour = "#dad9ca", linewidth = 0.3),
      panel.grid.minor = element_blank(),
      axis.text   = element_text(colour = "#46604a"),
      axis.title  = element_text(colour = "#2c3a31"),
      plot.title  = element_text(colour = "#16241d", face = "bold"),
      plot.subtitle = element_text(colour = "#5d6b61"),
      strip.text  = element_text(colour = "#16241d", face = "bold"),
      legend.position = "none"
    )
}
forest <- "#275139"; label <- "#46604a"; sage <- "#93a87f"
red <- "#b5534e"; faint <- "#5d6b61"; gold <- "#cda23f"Additive diversity partitioning in R
ecology tutorial
R
vegan
beta diversity
community ecology
Hill numbers
Split gamma diversity into alpha and beta additively in R with vegan adipart, test it with a null model, and see why Hill numbers matter for diversity indices.
Corrected 15 October 2026: the post said that only numbers equivalents give a beta you can compare across datasets, which fails for Shannon entropy, whose additive beta is the logarithm of the Hill beta of order one and does not depend on alpha; it now says so and keeps the rule for Gini-Simpson and richness. The subtitle of the index figure said only the diversity index differs between its panels; it now says the partition differs too.
Corrected 7 October 2026: the post read the below-null turnover among samples within a region as samples being more alike than chance; it now says the individual-based null inflates sample and regional richness, so at that level the test mostly shows individuals clumped within samples. It also read the large among-region excess over that null as showing the regions sharply distinct, and said additive richness beta avoided the dependence on alpha that troubles diversity indices; it now says the among-region excess mixes regional differences with the same clumping, so a null that shuffles whole samples among regions is the direct test, and that additive richness beta also grows with local richness when differentiation is held fixed.
Regional diversity is more than the diversity of any one site. Whittaker’s classic answer was multiplicative, gamma equals alpha times beta, so beta measured how many times richer a region was than an average site. Lande (1996) offered an additive alternative, gamma equals alpha plus beta, which keeps alpha and beta in the same units and lets you stack the pieces of a sampling hierarchy on top of one another. This post partitions richness additively in R with vegan, tests the result against a null model, and then shows why the additive beta needs care, for species counts as well as for diversity indices.
The additive identity
Additive partitioning writes total diversity as a sum:
gamma = alpha + beta
where alpha is the mean diversity of a single sample and beta is the average amount by which the whole exceeds a part. When samples are grouped into regions, the identity extends to as many levels as the design has:
gamma = mean sample alpha + (among samples within regions) + (among regions)
Every term is in species, so a beta of 20 means twenty species of turnover, full stop. That shared currency is what makes additive partitioning easy to read and easy to draw. The multiplicative form of Whittaker, and the dissimilarity-based framework of Baselga (2010), answer related questions in different currencies, and are worth keeping separate in your head.
Partitioning richness with adipart
We simulate a two-level design: three regions, five samples each, with overlapping species pools so that neighbouring regions share some species while distant ones do not. Within a region, each sample draws a subset of the regional pool.
set.seed(20)
nreg <- 3; per <- 5; nsamp <- nreg * per; npool <- 60
region <- factor(rep(paste0("R", 1:nreg), each = per))
comm <- matrix(0, nsamp, npool)
for (k in 1:nreg) {
  start <- (k - 1) * 16 + 1
  pool  <- start:min(start + 27, npool)          # overlapping regional pool
  for (r in which(region == paste0("R", k))) {
    present <- sample(pool, size = sample(10:16, 1))
    comm[r, present] <- rpois(length(present), 4) + 1
  }
}
comm <- comm[, colSums(comm) > 0]
c(samples = nrow(comm), species = ncol(comm), gamma = sum(colSums(comm) > 0))
samples species gamma
15 58 58 adipart takes the community matrix and a grouping formula. With comm ~ region it recognises two grouping levels, the sample (each row) and the region, and returns alpha and beta at each. The weights = "unif" setting gives every unit equal weight; index = "richness" partitions species counts.
dat <- data.frame(region = region)
set.seed(5)
ap <- adipart(comm ~ region, dat, index = "richness",
              weights = "unif", nsimul = 999)
S <- ap$statistic
a1 <- S[["alpha.1"]]; b1 <- S[["beta.1"]]
a2 <- S[["alpha.2"]]; b2 <- S[["beta.2"]]; g <- S[["gamma"]]
round(c(alpha.sample = a1, beta.within = b1,
        alpha.region = a2, beta.among = b2, gamma = g), 1)
alpha.sample beta.within alpha.region beta.among gamma
13.6 13.4 27.0 31.0 58.0 The mean sample holds 13.6 species. Within a region, samples add 13.4 species of turnover, bringing the regional mean to 27. The three regions then add another 31 species, reaching the total of 58. The whole decomposition is one sum: 13.6 plus 13.4 plus 31 equals 58.
comp <- data.frame(
  part = factor(c("mean sample richness (alpha)",
                  "among samples within region (beta 1)",
                  "among regions (beta 2)"),
                levels = c("among regions (beta 2)",
                           "among samples within region (beta 1)",
                           "mean sample richness (alpha)")),
  value = c(a1, b1, b2))
comp$lab <- sprintf("%.1f", comp$value)

ggplot(comp, aes(x = "community", y = value, fill = part)) +
  geom_col(width = 0.5, colour = "#f5f4ee", linewidth = 0.6) +
  geom_text(aes(label = lab), position = position_stack(vjust = 0.5),
            colour = c("white", "#16241d", "#16241d"), size = 4.4, fontface = "bold") +
  annotate("text", x = "community", y = g + 1.2,
           label = paste0("gamma = ", sprintf("%.0f", g)),
           colour = "#16241d", fontface = "bold", size = 4.2, hjust = 0) +
  scale_fill_manual(values = c("mean sample richness (alpha)" = forest,
                               "among samples within region (beta 1)" = sage,
                               "among regions (beta 2)" = gold),
                    guide = guide_legend(reverse = TRUE)) +
  scale_y_continuous(limits = c(0, 72), expand = expansion(mult = c(0, 0))) +
  coord_flip() +
  labs(x = NULL, y = "species richness",
       title = "Additive partition: gamma = alpha + beta, in species",
       subtitle = "total richness splits into mean local richness plus two turnover layers") +
  theme_te() +
  theme(legend.position = "top", legend.title = element_blank(),
        legend.text = element_text(colour = "#2c3a31", size = 8.5),
        axis.text.y = element_blank())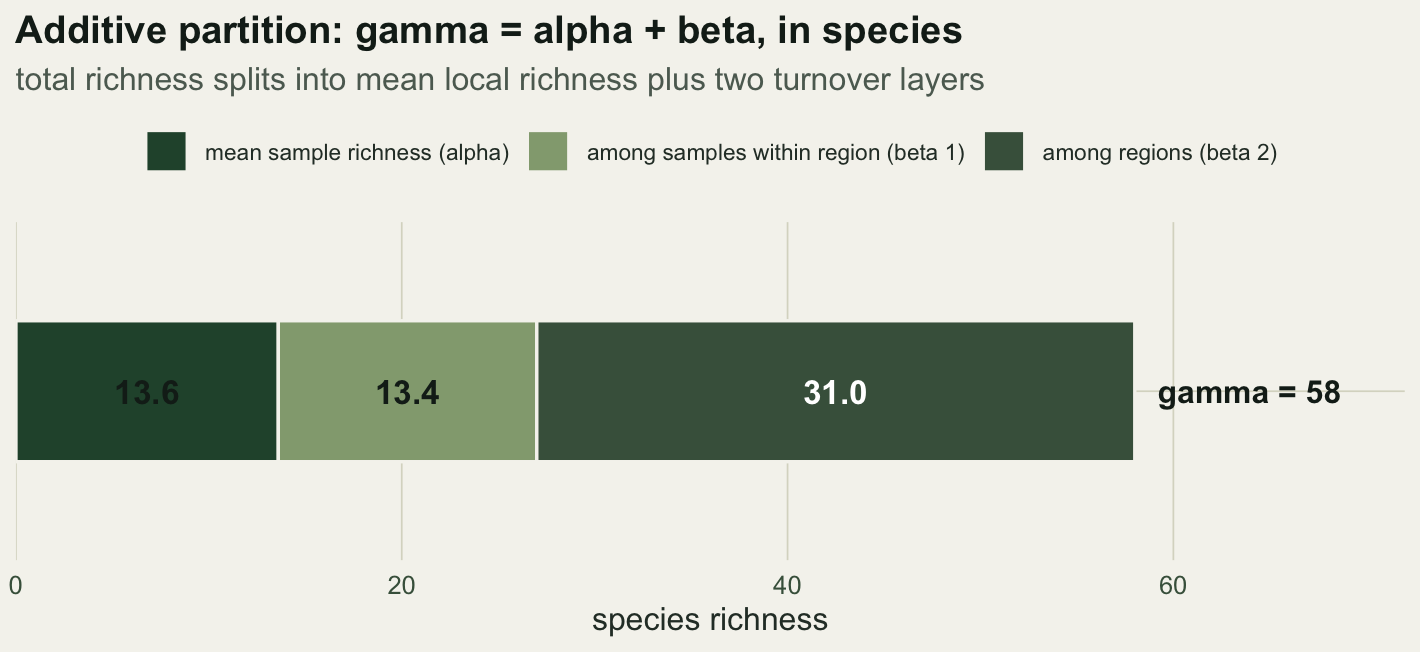
Testing against a null model
The numbers describe the data, but are they more structured than chance? adipart answers this with a randomisation test built on the r2dtable null model, which reshuffles individuals across the whole table while holding the row and column totals fixed. This individual-based null (Crist and colleagues 2003) asks what the partition would look like if individuals ignored the sample and regional structure entirely. The observed statistics come with a z-score and a permutation p for each level.
z  <- ap$oecosimu$z;    names(z)  <- names(S)
p  <- ap$oecosimu$pval; names(p)  <- names(S)
mn <- ap$oecosimu$means; names(mn) <- names(S)
round(c(among_region_obs = b2, among_region_null = mn[["beta.2"]],
        z = z[["beta.2"]], p = p[["beta.2"]]), 2)
among_region_obs among_region_null z p
31.00 1.80 48.02 0.00 Among-region turnover is the headline. Its observed value of 31 towers over the null mean of 1.8, with a z of 48 and a permutation p of 0.001. Under the null, spreading individuals at random across all fifteen samples makes every sample far richer and leaves the regions nearly identical, so this gap mixes real differences among the regions with the clumping of individuals within samples discussed below, and the individual-based test cannot separate the two. A large z here does not on its own show that the regions differ; a null that shuffles whole samples among regions keeps that clumping and is the direct test of regional differences.
dfb <- data.frame(beta2 = ap$oecosimu$simulated[5, ])

ggplot(dfb, aes(beta2)) +
  geom_histogram(bins = 40, fill = forest, colour = NA, alpha = 0.85) +
  geom_vline(xintercept = b2, colour = red, linewidth = 0.8) +
  annotate("text", x = b2 - 1, y = Inf, label = paste0("observed = ", sprintf("%.0f", b2)),
           hjust = 1, vjust = 1.8, colour = red, size = 3.6, fontface = "bold") +
  annotate("text", x = 6, y = Inf,
           label = paste0("null mean = ", sprintf("%.1f", mn[["beta.2"]]),
                          "\nz = ", sprintf("%.0f", z[["beta.2"]])),
           hjust = 0, vjust = 1.6, colour = faint, size = 3.5) +
  scale_y_continuous(expand = expansion(mult = c(0, 0.08))) +
  labs(x = "among-region beta under the individual-based null", y = "count",
       title = "Among-region beta far exceeds the individual-based null",
       subtitle = "observed among-region beta against 999 randomised communities") +
  theme_te()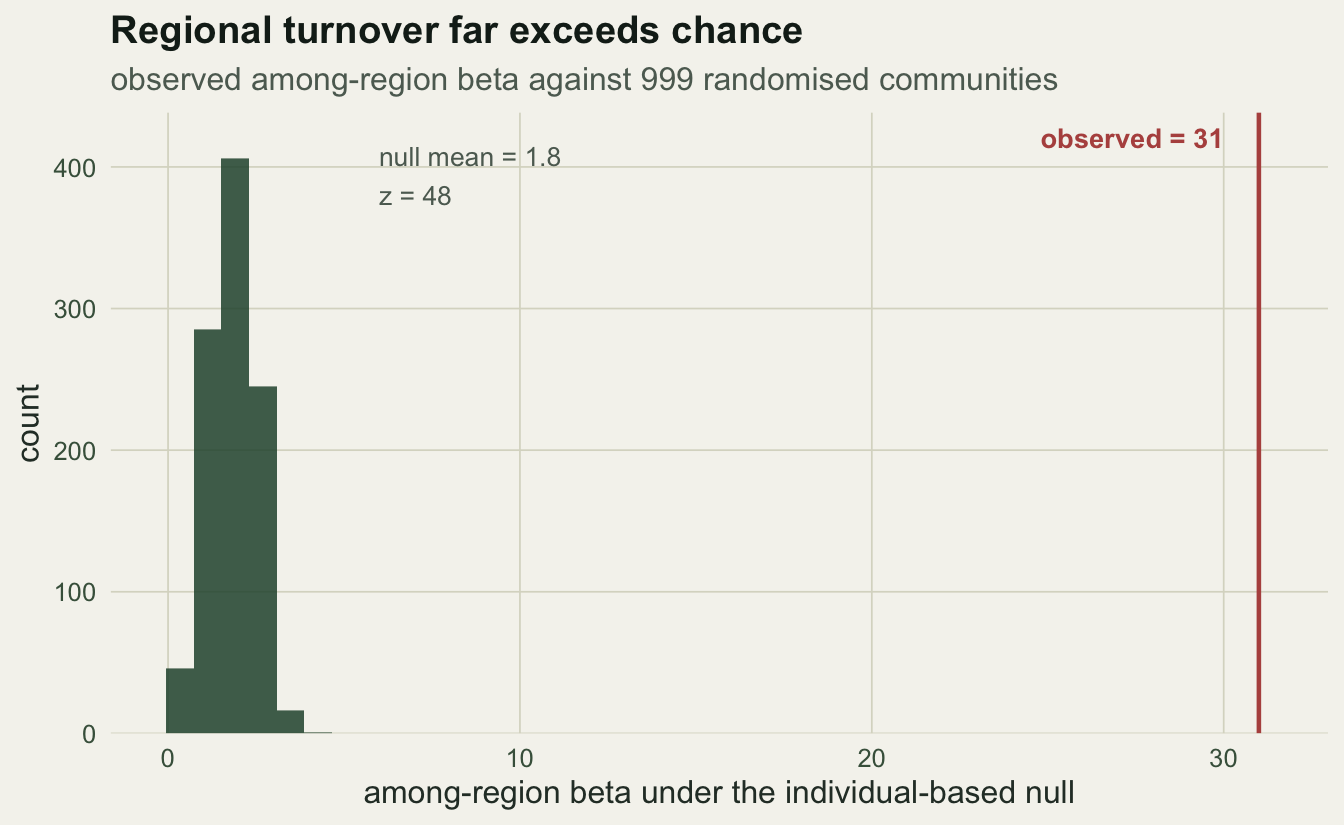
Turnover among samples within a region tells the opposite story. Its observed value of 13.4 sits below the null mean of 19.7, giving a negative z of -8.3. That does not mean samples from the same region are more alike than chance. Spreading individuals at random lifts mean sample richness from 13.6 to 36.5 and mean regional richness from 27 to 56.2, so at this level the individual-based test mostly shows that individuals are clumped within samples, not that samples share more species than chance would give.
Additive or multiplicative?
For richness, the additive form keeps its units: species are counts, and a difference of counts is again a count, so beta reads directly as species of turnover. The same additive recipe can also be applied to a diversity index such as Gini-Simpson. In both cases the identity holds arithmetically, but the beta it produces is not comparable across studies as a measure of differentiation, because its size depends on how much alpha diversity there is to begin with.
A short demonstration makes the problem concrete. Hold the ecology fixed at three fully distinct regions, each with the same number of equally abundant species, and vary that number. The regions are always completely different, so any honest measure of differentiation should return the same value. Additive Gini-Simpson beta does not, and neither does additive richness beta: gamma minus alpha here is twice the number of species per region, so it rises with local richness.
N <- 3; Sseq <- 2:30
demo <- data.frame(
  S         = Sseq,
  add_GS    = (1 - 1 / (N * Sseq)) - (1 - 1 / Sseq),   # additive Gini-Simpson
  mult_Hill = (N * Sseq) / Sseq)                       # multiplicative Hill, q = 2
c(add_GS_low = demo$add_GS[1], add_GS_high = demo$add_GS[length(Sseq)],
  mult_Hill  = demo$mult_Hill[1])
add_GS_low add_GS_high mult_Hill
0.33333333 0.02222222 3.00000000 As local richness climbs, additive Gini-Simpson beta falls from 0.333 towards 0.022, sliding towards zero even though the regions stay just as distinct. The multiplicative partition of Hill numbers avoids this. Converting Simpson to its numbers equivalent (an effective species count) and dividing gamma by alpha gives beta as an effective number of communities, which stays pinned at 3 regardless of richness. That is the value the ecology demands.
dd <- rbind(
  data.frame(S = demo$S, beta = demo$add_GS,    panel = "additive (Gini-Simpson index)"),
  data.frame(S = demo$S, beta = demo$mult_Hill, panel = "multiplicative (Hill numbers, q = 2)"))
dd$panel <- factor(dd$panel, levels = c("additive (Gini-Simpson index)",
                                        "multiplicative (Hill numbers, q = 2)"))

ggplot(dd, aes(S, beta)) +
  geom_line(colour = forest, linewidth = 1) +
  geom_point(colour = forest, size = 1.3) +
  facet_wrap(~panel, scales = "free_y") +
  labs(x = "species per region (local richness)", y = "beta diversity",
       title = "Why the choice of index matters",
       subtitle = "three fully distinct regions throughout; only the index and the partition differ") +
  theme_te() +
  theme(strip.text = element_text(size = 10.5))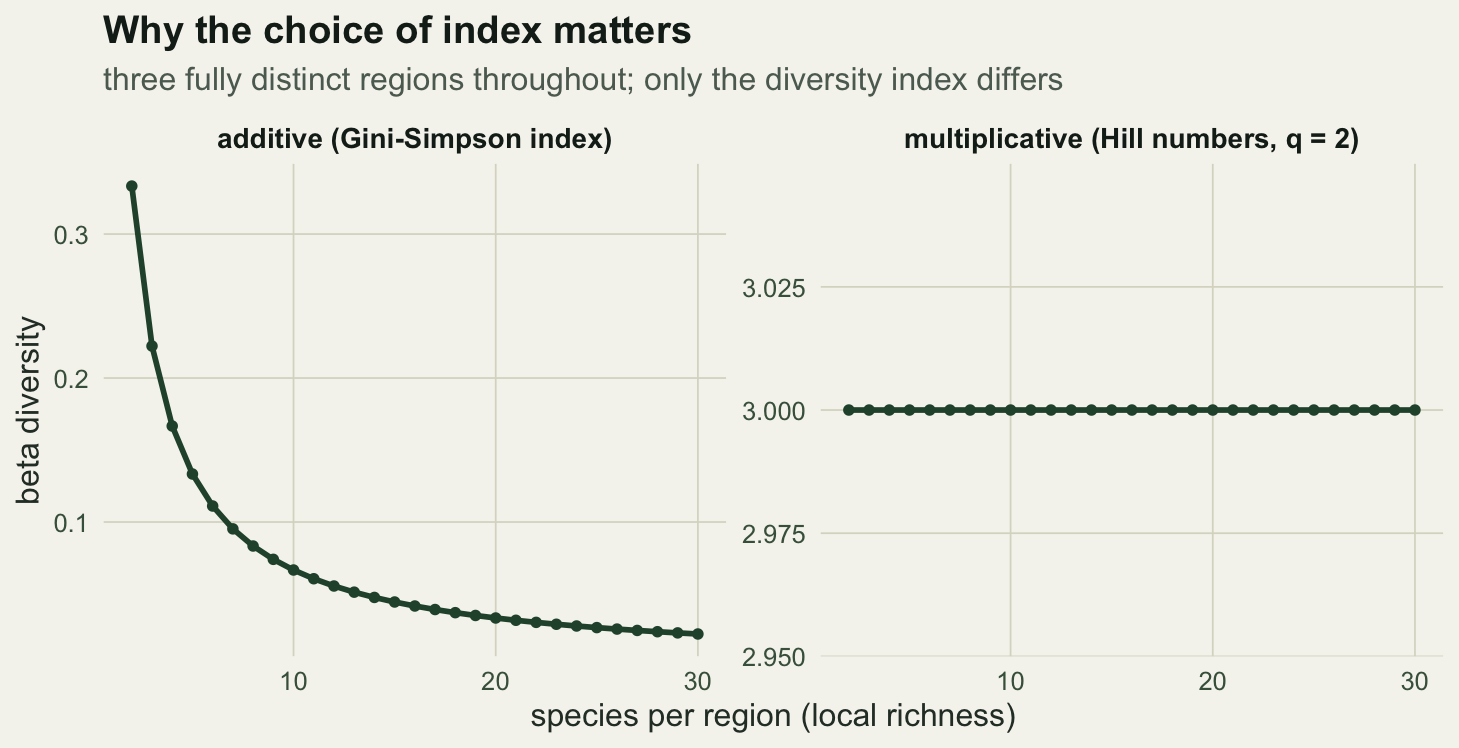
Shannon sits in between. Its entropy is additive, so the sample and turnover entropies do add to the total, but entropy is measured in nats, not communities. Exponentiating turns Shannon entropy into a Hill number, and at that point the partition becomes multiplicative again. The clean way to think about it is that raw indices partition additively while their numbers equivalents partition multiplicatively. For Gini-Simpson and for richness, only a multiplicative partition of numbers equivalents gives a beta you can compare across datasets. Shannon is the exception: its additive beta is the logarithm of the multiplicative Hill beta of order one, so it does not depend on alpha (Jost 2007), and in the demonstration above it would stay fixed whatever the richness.
What to take away
Additive partitioning with adipart is a direct, testable way to break total richness into local diversity and layers of turnover. Its default randomisation test compares each layer with an individual-based null, and that comparison also picks up how individuals clump within samples, so a departure at one layer does not on its own show structure at that layer; to test whether regions differ, shuffle whole samples among them. Read the beta terms of the species-based partition as species of turnover, not as measures of differentiation, since even at fixed differentiation they grow with local richness. To compare differentiation, and whenever you partition a diversity index rather than a raw species count, use Hill numbers (richness is already one) and partition multiplicatively, so that beta means a number of distinct communities that does not secretly depend on how rich your sites happen to be.
References
Lande, R. 1996. Oikos 76(1):5-13 (10.2307/3545743).
Baselga, A. 2010. Global Ecology and Biogeography 19(1):134-143 (10.1111/j.1466-8238.2009.00490.x).
Crist, T.O., Veech, J.A., Gering, J.C. and Summerville, K.S. 2003. American Naturalist 162(6):734-743 (10.1086/378901).
Jost, L. 2007. Ecology 88(10):2427-2439 (10.1890/06-1736.1).
Veech, J.A., Summerville, K.S., Crist, T.O. and Gering, J.C. 2002. Oikos 99(1):3-9 (10.1034/j.1600-0706.2002.990101.x).